


11 - The Big Melt
The snowdown between the sun and the ice. Water the results?


There is no consensus narrative or self-consistent theory that evidently explains why or how the Last Glacial Period (LGP) ended. The next 20-odd posts will attempt to rectify this by presenting the soup-to-nuts play-by-play summary of the end of LGP, the Big Melt. The next few posts will document the processes governing the energy interplay between solar irradiation, the greenhouse effect, ice cover, and geomagnetic and geothermal energy. These posts will take a uniformitarian approach: recent observations are the key to understanding past processes.
The Pleistocene Glaciations and the Last Glacial Period
The Pleistocene Epoch (2.58 million - 11,700 years ago) was characterised by long, cold periods - glacials - during which large North American and Eurasian continental ice sheets grew and advanced, separated by short, temperate periods - interglacials - during which the ice sheets melted and retreated. The Late Pleistocene, or Tarantian (126,000 - 11,700 years ago) began when the Penultimate Glacial Period was terminated by the Eemian interglacial period (126,000 - 115,000 years ago), which in turn was succeeded by the Last Glacial Period (LGP). The end of the Younger Dryas/Late Pleistocene (11,700 years ago) is defined as the start of our current interglacial period, the Holocene.

The figure above presents the ice volume and temperature changes over the last 450 thousand years as determined from the ice core data of two central Antarctic drill locations, EPICA and Vostok. Their rough ~100 thousand year cyclicity is often attributed to so-called Milankovitch cycles, the climate effects caused by changes in the Earth's rotation around its axis and its orbital path around the Sun, though the mechanism by which this might occur is not evident. The main cycle of interest for the end of the LGP is the Earth’s axial precession. The Earth’s rotational axis describes a circular motion relative to fixed stars, much like a rolling spinning top.
This causes variations in the areas of Earth that are closest to the Sun at Earth’s perihelion (the closest orbit point to the Sun) with a cyclicity of ~25,700 years. Due to Earth’s axial precession the Northern hemisphere was about 3% closer to the Sun roughly 15,700 years ago, which in itself is not sufficient to trigger the Big Melt - otherwise why wasn’t it triggered one cycle earlier at 41,400 years ago? - but which definitely provided a nice melt boost.
Glacial and Interglacial steady states
The great similarity between the individual glacial/interglacial cycles (graph) suggests that for at least 450,000 years Earth has been switching between two steady-states: one glacial, one interglacial. The graph above demonstrates that a rapid increase in temperature concurred with the ice melt at the start of the Eemian interglacial around 126,000 years ago. Note the cautious use of the word “concur”, as cause and effect are often unclear. Both are obviously due to a more efficient capturing of the Sun’s energy, but did the ice melt because of a temperature increase, or did the ice melting cause a more efficient energy capture and temperature increase? Most likely both increased as part of a positive feedback loop, i.e. melting and increasing temperatures positively boosted each other. After a relatively short, 11,000 year interglacial period, the Eemian ended with a sudden decrease in temperature that concurred with the increase in ice volume that heralded the start of the LGP. These rapid transitions indicate feedback loops are likely in play: once a major shift in conditions disrupts the steady-state and starts the ice melt or growth, a feedback loop causes the melt/growth to continue or accelerate. Temperatures continued to drop and ice sheets continued to grow over the LGP though their rate of decrease/growth decreased as time progressed, leading to the asymptotic curves in the graph above. The feedback loops apparently lose their efficiency once the steady-state glacial period is approached.
Transition energy
A glacial steady-state is characterized by the onshore storage of huge amounts of “negative” energy and water in the form of ice sheets on land. During the interglacials “positive” energy melts the ice, whereafter the heated meltwater’s positive energy is stored in the world’s oceans, where it can be used to drive the weather systems than can melt more ice.
A rough back-of-the envelope estimates the magnitude of land-stored “negative” energy. The previous post mentioned that Earth’s sea level rose by 120 m after the last glacial maximum 20,000 years ago. Assuming Earth’s oceans covered 350 106 km2 during the last glacial maximum then the amount of water coming from the Big Melt roughly equalled 350 106 km2 * 0.12 km = 42 106 km3 of water, or enough to fill 11 Mediterranean Seas. Assuming an ice density of 900 kg/m3 means roughly 38 1021 g of ice were melted, requiring 1.3 1025 J, the equivalent of over a billion atomic bombs. Or stated differently: per meter of sea level rise roughly 1023 J melted ~0.35 million km2 of a 1 km thick ice sheet. Note that the energy required to melt 1 g of ice - 80 cal - is almost two orders of magnitude larger than the energy required - 1 cal - to heat 1 g of water by 1 °C: melting ice is work-intensive.
Same ol’ Sun
The previous post demonstrated that the Sun almost certainly supplied the energy for the Big Melt, yet solar irradiation does not vary much in strength: over the last 140+ years the Total Solar Irradiance (TSI) has only fluctuated about its mean by less than 0.1%. Solar irradiance provided the energy for the Big Melt, but its variations very likely did not start it

Albedo
The albedo of a surface is defined as the fraction of solar irradiation that is reflected by it.

Unglaciated surfaces, such as woodlands, wetlands, savanna’s, etc., typically have albedos ranging from ~0.1 (woods) to ~0.35 (barren deserts). Glaciated surfaces typically have albedos ranging from ~0.6 (dirty or slushy snow) to ~0.9 (fresh snow). Open ocean water has a low albedo of ~0.07. Sea ice and glacier formation therefore cause huge albedo shifts: the high albedo of ice causes most incident solar energy to be reflected, not absorbed as sensible heat.
The greenhouse effect
The solar energy that isn’t reflected by Earth’s surface is absorbed by it as sensible heat that in turn is fully or partially re-emitted as thermal radiation (heat energy). Atmospheric greenhouse gasses such as H2O and CO2 can capture energy at certain frequencies of such radiated heat. At mid-latitudes (“Mediterranean Model” in figure below) this causes an overall positive radiative forcing (net heat capture) that delays thermal energy radiation to space, resulting in an increase in near-surface temperatures. The radiative forcing over ice sheets (“Antarctica” in figure below) is negative (net energy loss to space) as the relatively warm greenhouse gases in the troposphere - mainly CO2, O3 and H2O - radiate more thermal energy to space than the cold ice surface radiates from its ice sheets[2]. The extra lost energy must therefore be excess heat coming from the lower latitudes.

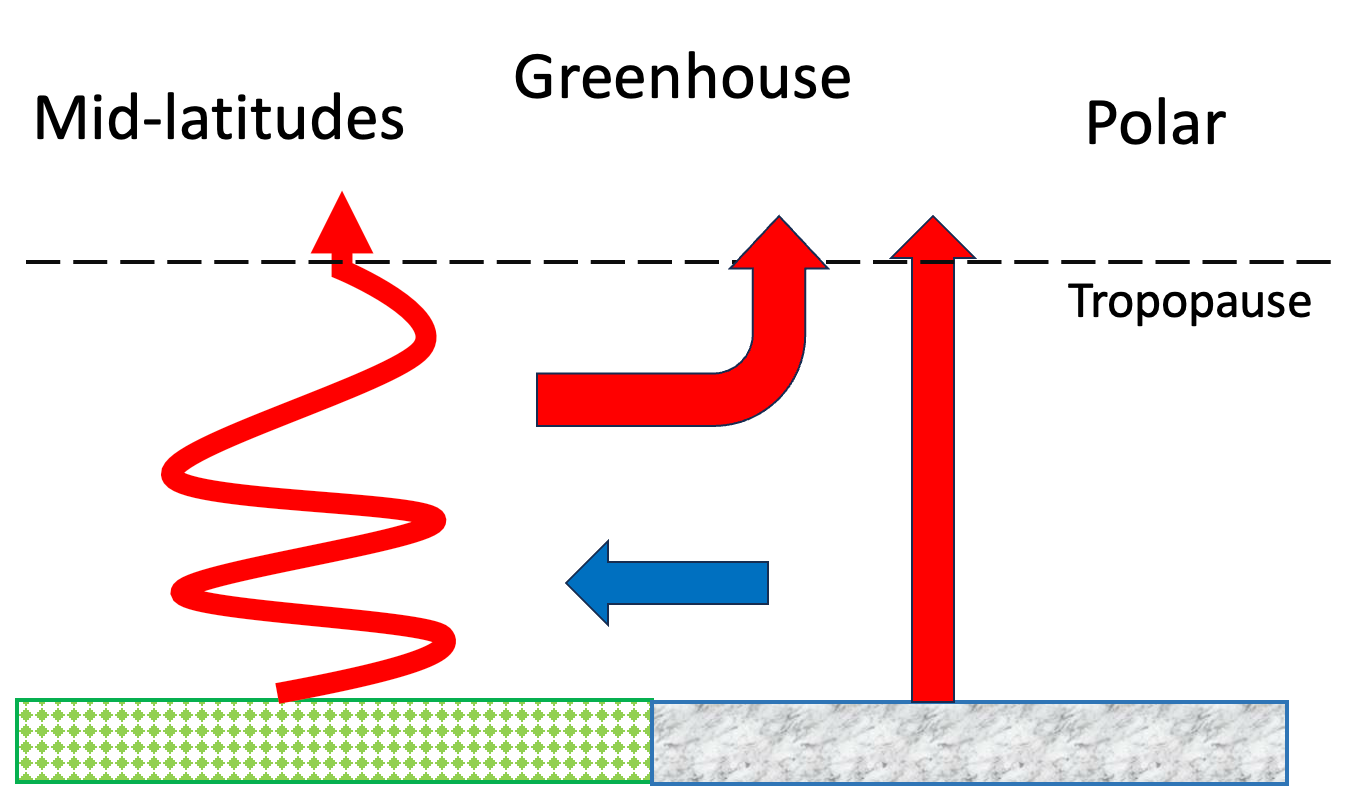
This effectively explains the great stability of the glacial and interglacial steady-state regimes, and why they are relatively difficult to end. Interglacial areas absorb and retain more energy, while glacial areas reflect and effectively radiate more energy to space. Terminating the steady-state therefore requires a disruptive force that interrupts or overwhelms the thermal energy storage and emission systems. In practice it can be very difficult to convert one to the other. Some scientists believe that the Earth was completely frozen during the Cryogenian (720-635 million years ago). One of the main arguments against a “Snowball Earth” is that many physicists believe it would be almost impossible to recover from this state.
The playing field

Currently, the Arctic remnants of the LGP cover parts of the Arctic Ocean, Northern Canada and Greenland, though only the last still has a thick ice sheet that contains significant amounts of ice and “negative” energy. The global sea levels have not risen significantly for the last 7000 years, indicating that these Arctic LGP remnants have remained relatively stable and difficult to melt during the current interglacial. Every year the ice advances during the winter and retreats again during the summer. A glacier can only permanently advance if its snow cover does not entirely melt during the summer. The minimum conditions for ice sheet growth are therefore large annual snowfall (precipitation) and cold summers. Once a permanent snow cover has been established, the glacial feedback loop described above will favor the development of a permanent glacier.

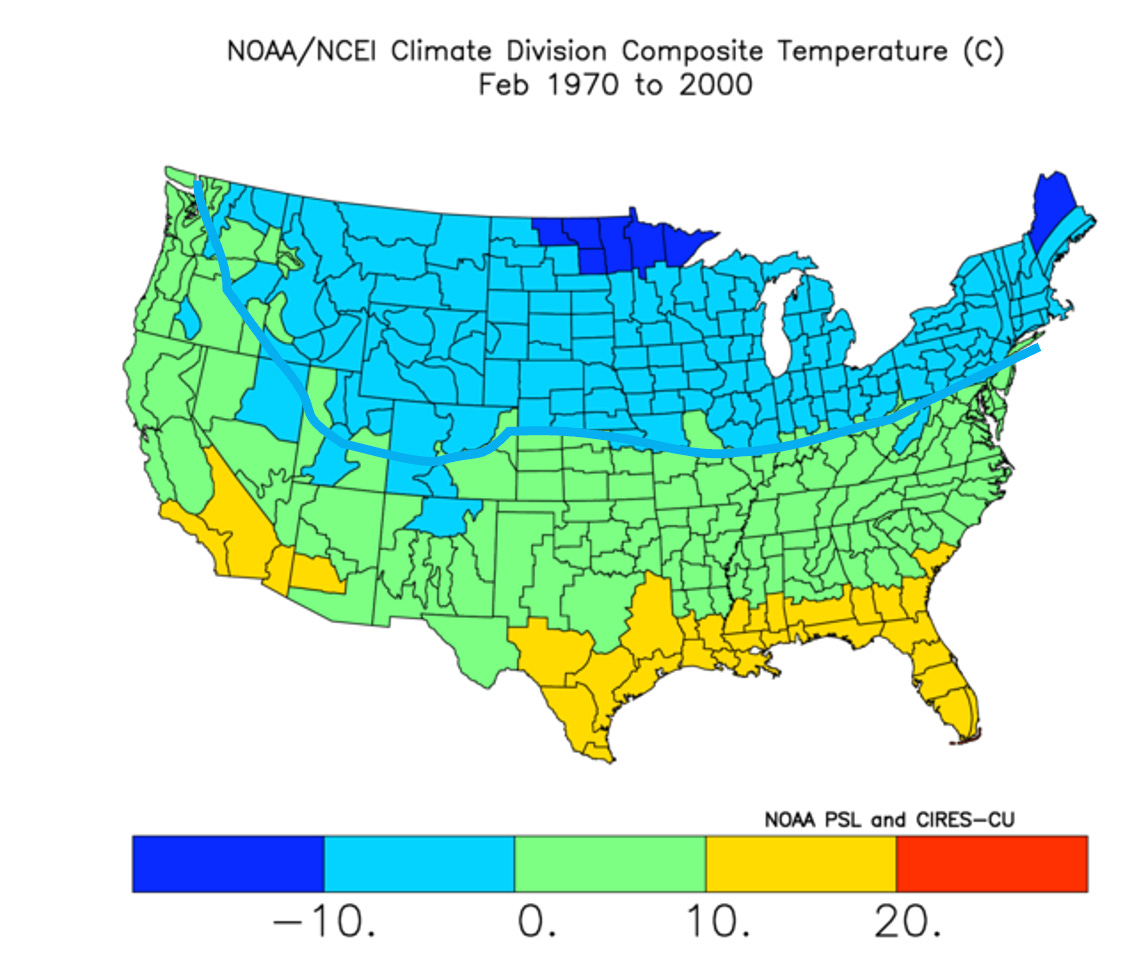
The LGP maximum ice sheets covered nearly all of Canada and North Eastern USA. Despite average North American temperatures being roughly 6 °C colder [3] near the ice front, the LGP ice advance terminated roughly where presently a) the average February temperature is freezing and b) the average February precipitation exceeds 2 inches. The ice sheet likely terminated near the Canadian border in the Western US due to a lack of snowfall (precipitation), which in turn is due to the rain shadow caused by the western US mountain ranges. In the Eastern US the ice sheet terminated near the Indiana-Ohio-Pennsylvania southern borders due to the lack of freezing temperatures in the more southerly states, which in turn is due to the North Atlantic Equatorial Current and its weather systems that bring warm moist air to this area. Note that this current also heated these states during colder glacial periods, such as the Younger Dryas[4]

The (northwestward moving) North Atlantic Equatorial current causes both warmer temperatures and a marked ocean temperature gradient along the East coast, while the (southward moving) North Pacific/California Current causes relatively uniform temperatures on the West coast. On the East coast, winter water temperatures are a few degrees above freezing to the north of the LGP maximum advance line, but are well above freezing immediately south of the line.
In summary, stable interglacial and glacial steady-states exist. The transition from one into the other requires a major energy push or pull that disrupts their steady-state energy storage and emission systems. Whether the ice sheets advance or retreat is largely attributable to the average summer temperatures and annual precipitation amounts, both of which are largely a function of continental geometries and ocean currents. The next post will look at the conditions under which the ice sheets locally grow or melt.
References:
[1] Kopp, G., 2019: Historical Total Solar Irradiation (TSI) data,
[2] Happer, W., van Wijngaarden, B., 2023, Atmosphere and Greenhouse Gas Primer, https://arxiv.org/abs/2303.00808
[3] Tierney, J.E., Zhu, J., King, J. et al. Glacial cooling and climate sensitivity revisited. Nature 584, 569–573 (2020). https://doi.org/10.1038/s41586-020-2617-x
[4] Carlson, A., 2013, The Younger Dryas Climate Event. In: Elias, S.A. (editor). The Encyclopedia of Quaternary Science 3: 126–134. Amsterdam: Elsevier.
It is nice to see someone addressing the question of changes between ice ages and interglacials. That is the real climate change challenge facing humanity. Not the catastrophic man-made global warming alarms of the UN IPCC COP, EU, WEF, White House, Sierra Club, Greenpeace.
You did a good job explaining Infrared Radiation escaping to space near the equator and the poles.
We need fossil fuels and their by-products for as long as they will be available. We should not use fossil fuels wastefully, like 600,000,000 cars stuck in rush hour traffic because of poorly designed cities and roadways. Cities should be designed to maximize shorter commutes. Keep good living choices closer to good job opportunities. Maximize electrified rail and bus public transportation.
Great to have your contributions to the CO2 Coalition
John Shanahan
Member of CO2 Coalition
website: allaboutenergy.net