


13 - The beginning of the end: the Oldest Dryas
The eldest "cool" Dryas triplet who broke the ice


Some historically unusual events accompanied the end of the Last Glacial Period:
A 120-130 m sea-level rise
Large surface temperature fluctuations of up to 15 °C and 10 °C in central Greenland and Antarctica resp.
Numerous huge solar particle events (“solar flares”) between 21,500 - 10,000 BP
The Lake Missoula Floods: over 100 catastrophic floods that occurred in the Northwestern USA between 20,000 - 14,000 years ago, peaking at 18,500 BP
Abnormally low geomagnetic field strengths between 14,000-10,000 BP; a directional geomagnetic excursion and a failed reversal around the start of the YD (13,000 BP)
Active volcanism: the Laacher See (Germany) eruption (VEI = 6) around 12,900 BP as well as Mount St. Helens (USA) during the “Couger Stage” (20,500 - 18,000 BP) and the "Swift Creek Stage" (16,000–10,500 BP)
A return to colder temperatures and advancing glaciers in much of Eurasia and Greenland during the Younger Dryas (YD; 12,850-11,700 BP)
An abrupt doubling of atmospheric radiocarbon around the start of the YD
The Late Pleistocene megafaunal extinction of almost 80% of the large to medium-sized mammals in North and South America that peaked in the YD.
Göbekli Tepe, a large, Neolithic monument complex in southwest Asia that was founded around 11,500 years ago (just after the Younger Dryas), and that was abandoned and purposely buried roughly 10,000 years ago.
This post series will explain the significance of these events and how they all linked.
A simple explanation of how the LGP ended is for the simple-minded
There is currently no scientific consensus on how the Last Glacial Period (LGP) ended, and huge amounts of critical thinking and skepsis should be employed when learning from this substack or from the fairly large group of scientists, crackpots and pundits who claim to have some answers.
Two previous posts demonstrated that the "It's a comet!" group cannot plausibly explain the events above: the observations don't match their theory very well.
A theory’s inability to explain past events is usually 'splained away by adding assumptions: multiple comets, airbursts not impacts, much larger than ever recorded, etc. A previous post demonstrated that each added assumption decreases a theory’s overall probability, often to the point of “very unlikely” (p < 10%). The next posts therefore employ Occam's Razor: the most parsimonious theory that explains the observations with the fewest assumptions wins. This post series will only reach conclusions that are likely (probability p > 66%), very likely (p > 90%), or almost certain (p > 99%).
Data Sources
This post series will start at the end of the Last Glacial Period (LGP) and work its way through 15,000 years of subsequent melting. It will integrate information from numerous authors and data sources:
The Greenland ice cores: GRIP, GISP2, NorthGRIP, NEEM, etc.
The Antarctic ice cores: EPICA, Vostok, WDC, EDML, etc
Onshore observations: (paleogeographic) reconstructions of the North American and Eurasian ice sheets.
Onshore and offshore sediment cores, tree-ring data, speleothem data, etc
The Oldest Dryas - buyer beware!
The term "Oldest Dryas" (OD) refers to a period just before the Bølling-Allerød interstadial (a “warmer” period between 14,690-12,850 BP) when Greenland and a large part of Eurasia experienced colder temperatures. The term was originally used as a biostratigraphic (a geologic age determination system based on fossil flora and fauna) subdivision characterized by the relative abundant occurrence of the remains of Dryas octopetalys, an indicator species of arctic-alpine regions. The term is currently more commonly used as a chronostrategraphic (geologic age determination method based on time) subdivision, in a manner similar to its younger counterparts the "Older" and "Younger" Dryas, and will be used in such a manner in these posts.
The First Interglacial Period and the Oldest Dryas in Antarctica

The Last Glacial Maximum (LGM; 22,000 BP) ice extent in the Southern Hemisphere is much more uncertain than its Northern counterpart due to the absence of comprehensive onshore observations. Best estimates [1] place it roughly where presently the sub-tropic currents brush against the Antarctic circumpolar current, likely indicating these warm currents limited the further expansion of Antarctic sea ice cover at the time of the LGM.

The figure above demonstrates that during the First Interglacial Period (FIP; 22,000 BP - 18,500 BP) the WDC location’s surface temperatures (ST) increased while the ice accumulation rate (AR) remained consistently low, but that during the Oldest Dryas (OD; 18,500 - 14,690 BP) ST and AR both increased in lock-step. Some observations:
Antarctica warmed during the OD, in contrast to Eurasia and Greenland
The ST increased ~8 °C during the OD, and remained high thereafter, but still remained well below freezing.
The AR doubled over the OD, and remained high thereafter
Recalling the previous post’s glacier growth model:

During the FIP the ST increased - though remained severely freezing - while AR (precipitation) remained the same: the WDC location was in the “Slow Growth Zone”, remote from open oceans. This is consistent with the map above that suggests an open ocean distance on the order of 2500 km. During the FIP however the location’s distance to open oceans was decreasing, as is evidenced by rising temperatures: WDC experienced an increase in heat energy but no increase in moisture. The distance to open oceans was decreasing due to Antarctic sea ice melting.
During the OD the ST increased - though remained severely freezing - while precipitation increased: around 18,500 BP the WDC location entered the “Goldilocks Zone” due to the open oceans getting progressively closer due to further sea ice cover melting. The conclusion is therefore that the Antarctic sea ice cover very likely started to melt after the LGM - during both the FIP and OD - thereby progressively reducing the distance between the WDC location and the open ocean.
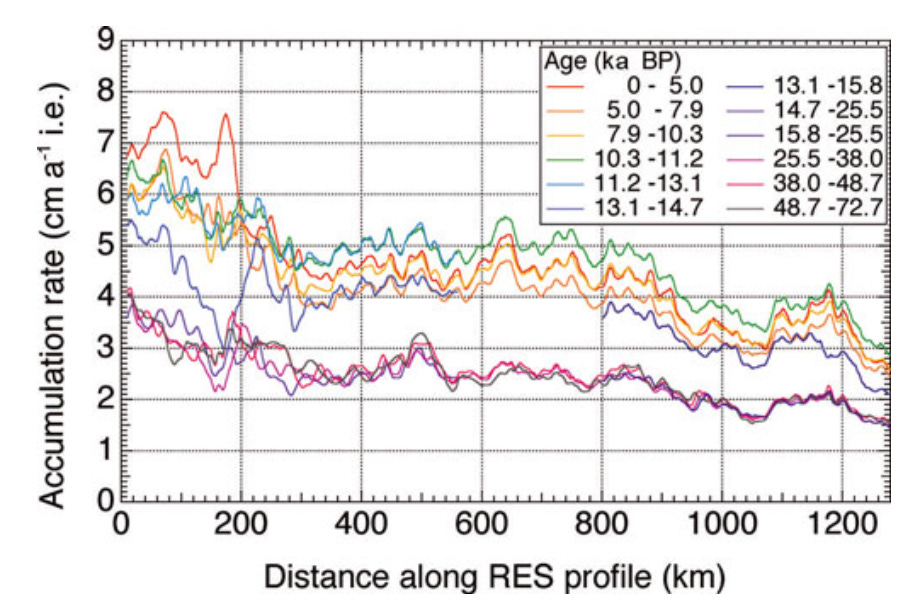
This interpretation is supported by the “RES” profile between the Kohnen (EDML) and Dome Fuji locations[3] (see map above) on the opposite side of the continent. The initially low accumulation rates (~1-4 cm/a) before 25,500 BP roughly double (~2-7 cm/a) sometime during the 15,800 - 25,500 BP interval. The area around the “RES” profile very likely became progressively closer to open oceans during the FIP and OD intervals due to Antarctic sea ice cover melting: coast-proximal locations (EDML) systematically had larger accumulation rates during the entire post-LGM period. Note that many authors claim the end of the LGP started around 15,000 BP (e.g. [8]), but the most dramatic changes to Antarctica had already occurred by the end of the OD.
What happened up north?


The graph above indicates something similar yet different happened in Greenland. The maps above suggests that at the time of the LGM open oceans were at least 2000 km away. Similar to Antarctica, warm subtropical currents - the Gulfstream - apparently limited the North Atlantic sea ice cover advance. During the FIP and OD initial surface temperature (ST) rises was likely caused by North Atlantic sea ice cover melting: the ST rose but the Accumulation Rates (AR) remained low, and Central Greenland remained in the “Slow Growth Zone”.

A significant sea level rise during the OD (figure above) however demonstrates that some onshore glaciers were melting. These meltwaters very likely came from the Northern Hemisphere onshore ice sheets as most of Antarctica’s land glaciers by then were in the “Goldilocks” growth zone, thereby increasing their land storage of water.
North American paleogeographic reconstructions (figure below) support this theory. Some onshore melting occurred between 19,500 - 18,500 BP (“M” in the GISP2 figure above) in the New York - Great Lakes area (yellow area in figure), likely due to the east coast offshore sea ice cover retreating northwards, resulting in onshore ST increases.

By 18,200 BP however the glaciers had re-advanced in the Great Lakes area, likely due to the offshore sea ice cover partially re-establishing itself.
Significant onshore melting occurred in the western US during the OD. Western North American onshore melting is consistent with the observed megaflooding events mentioned at the start:
The Lake Missoula Floods: over 100 catastrophic floods that occurred in the Northwestern USA between 20,000 - 14,000 years ago, peaking at 18,500 BP
European paleogeographic reconstructions [6] indicate the (then onshore) North Sea area lost its ice cover around 18,500 BP, while most of the UK and Denmark lost their ice cover between 18,000 - 15,000 BP, further contributing to the OD sea level rise.
Summary
The glacial growth model outlined in the previous post can be used to explain the observed temperature, accumulation rate, and sea level changes that occurred in the period between the Last Glacial Maximum and the Bølling-Allerød. During the First Interglacial Period (FIP; 22,000-18,500) the sea ice cover retreated in the circum-Antarctic and the Northern Atlantic, resulting in 2-4 °C surface temperature increases in both onshore Antarctica and Greenland, onshore melting in the New York and Great Lakes area, but no major accumulation rate or sea level changes. During the Oldest Dryas (OD; 18,500 - 14,690 BP) the sea ice cover continued to retreat near Antarctica, but advanced near central Greenland and the US east coast. Significant onshore melting occurred during the OD in both western North America and Eurasia, resulting in a ~10 m sea level rise.
The next post discusses the causes of this this initial melting phase.
References:
[1] Hodgson, D., et al., 2014, Terrestrial and submarine evidence for the extent and timing of the Last Glacial Maximum and the onset of deglaciation on the maritime-Antarctic and sub-Antarctic islands, Quaternary Science Reviews, 100, 137-158, https://doi.org/10.1016/j.quascirev.2013.12.001.
[2] Fudge, T. J. et al., 2016, Variable relationship between accumulation and temperature in West Antarctica for the past 31,000 years, Geophys. Res. Lett., 43, 3795–3803, doi:10.1002/2016GL068356.
[3] Huybrechts, P., et al., 2009, Past and present accumulation rate reconstruction along the Dome Fuji–Kohnen radio-echo sounding profile, Dronning Maud Land, East Antarctica. Annals of Glaciology, 50, 112-120. doi:10.3189/172756409789097513
[4] Svensson, A., et al., 2020, Bipolar volcanic synchronization of abrupt climate change in Greenland and Antarctic ice cores during the last glacial period, Clim. Past, 16, 1565–1580, https://doi.org/10.5194/cp-16-1565-2020
[5] Alley, R.B., 2000, The Younger Dryas cold interval as viewed from central Greenland. Quaternary Science Reviews, 19, 213-226.
[6] Hughes, A., et al., 2016, The last Eurasian ice sheets – a chronological database and time‐slice reconstruction, DATED‐1. Boreas, 45.1, 1-45.
[7] Anderson, B., Borns, H., 1994, The Ice Age World: An Introduction to Quaternary History and Research with Emphasis on North America and Northern Europe During the Last 2.5 Million Years. Oxford University Press, ISBN: 978-8200218104
[8] Severinghaus, J., Brook, E., 1999, Abrupt Climate Change at the End of the Last Glacial Period Inferred from Trapped Air in Polar Ice". Science, 286, 930–4. doi:10.1126/science.286.5441.930. PMID 10542141.