


15 - The Lake Missoula Megafloods
When the Cordilleran Ice Sheet still gave a dam


A previous post noted:
The Lake Missoula Floods: a series of 100+ catastrophic floods that occurred in Northwest USA between 20,000 - 14,000 BP, peaking at 18,500 BP
Active volcanism: Mount St. Helens (USA) during the “Couger Stage” (20,500 - 18,000 BP) and the "Swift Creek Stage" (16,000–10,500 BP)
The Lake Missoula megafloods have been a source of controversy ever since geologist J Harlan Bretz first described and interpreted them in the 1920’s. Fortunately, current disputes concern details that mainly vex the experts: how many floods and when, flood trajectories, etc. A recent article by several of the most prolific megaflood authors summarizes the current state of knowledge[1]:

Between 20,000 - 14,000 BP the 30,000 km2 eastern Washington State area known as the Channeled Scabland suffered repeated megafloods, as is evidenced by extraordinarily large erosion features such as coulees, cataracts, huge boulder bars, etc.
These megafloods had discharge rates of up to 20 million m3/s, or roughly 90 times the discharge of the Amazon, or 20 times the total of all present-day rivers. The flood frequency increased but flood magnitudes decreased from 18,500 BP onwards. The floods’ varied Scabland trajectories joined the Columbia river before the Wallulla Gap, beyond which they flowed via the Columbia into the Pacific Ocean.
The floods originated in or passed through the 2500 km3 glacial Lake Missoula, which was regularly dammed by the repeatedly-advancing 1 km thick Purcell Trench Lobe glacier of the Cordilleran ice sheet.
Most of the megafloods also passed through glacial Lake Columbia that between 18,500 - 15,500 BP was regularly dammed by the repeatedly-advancing Okanagan Lobe glacier of the Cordilleran ice sheet. When Lake Columbia burst through its banks, often as a consequence of a Lake Missoula flood entering it, its floodwaters followed varied Channeled Scabland trajectories (Moses Coulee, Grand Coulee, Telford-Crab-Creek, Cheney-Palouse, Columbia) .
Flooding frequency was on the order of once every 100 years to once a year for the final, smaller floods.
Lake Missoula generated floods for at least 3000-4000 years between 20,000 - 14,000 BP. The floods ended before the 13,700– 13,400 BP Glacier Peak eruption, whose tephra overlay all flood deposits.
Canada at the time of the Last Glacial Maximum

At the time of the Last Glacial Maximum (LGM) Canada was almost entirely covered by two large ice sheets: the large, eastern Laurentide ice sheet (LIS) and the smaller, western Cordilleran ice sheet (CIS). The two joined up along a “suture zone” (SZ) that roughly coincided with eastern the edge of the Canadian Rockies. Both the CIS and LIS glaciers were advancing/flowing to the south in the south, to the north in the north, and to the middle in the middle (graph right above) along the SZ. The previous post documented that intense melting occurred along the SZ during the Oldest Dryas (OD) and the First Interglacial period (FIP), which is highly unusual and unexpected as the glacier growth model used in previous posts would suggest that an area that’s remote from open oceans should be in the “Low Growth” or the “Goldilocks” zone and not in the “Battle Zone”, where melting occurs.
Canadian LGM Paleoclimate


Some qualitative conclusions can be reached from modern climate data. LIS ice thicknesses and current annual Canadian precipitation trends suggest that at the time of the LGM the LIS’s precipitation likely came from weather systems accessing moisture from an open ocean to the southeast (Atlantic Ocean). Such precipitation was sufficient to generate the three LIS “domes” (sweet spots in the Goldilocks Zone). The CIS’s precipitation likely came open ocean’s to the west (Pacific Ocean) and was sufficient to allow the CIS to repeatedly prograde into the Washington State area during the FIP and OD[1]. SZ precipitation and accumulation rates were likely lower than in most of the LIS and CIS: its thinner glaciers were very likely more vulnerable to melting back than the thick LIS and CIS glaciers.
The average temperature of the SZ was likely colder than the same latitude but more coastal CIS and Quebec dome, indicating that it should not have been in the “Battle Zone”, where melting occurs. The suture zone’s melt started when the theoretically more vulnerable CIS glaciers were growing and advancing[1]. In addition, the SZ melted in an unexpected fashion, from its northern and southern ends towards the middle. Elevated geothermal heat flux very likely caused the SZ melting.
Antarctic ice sheet flow and melting
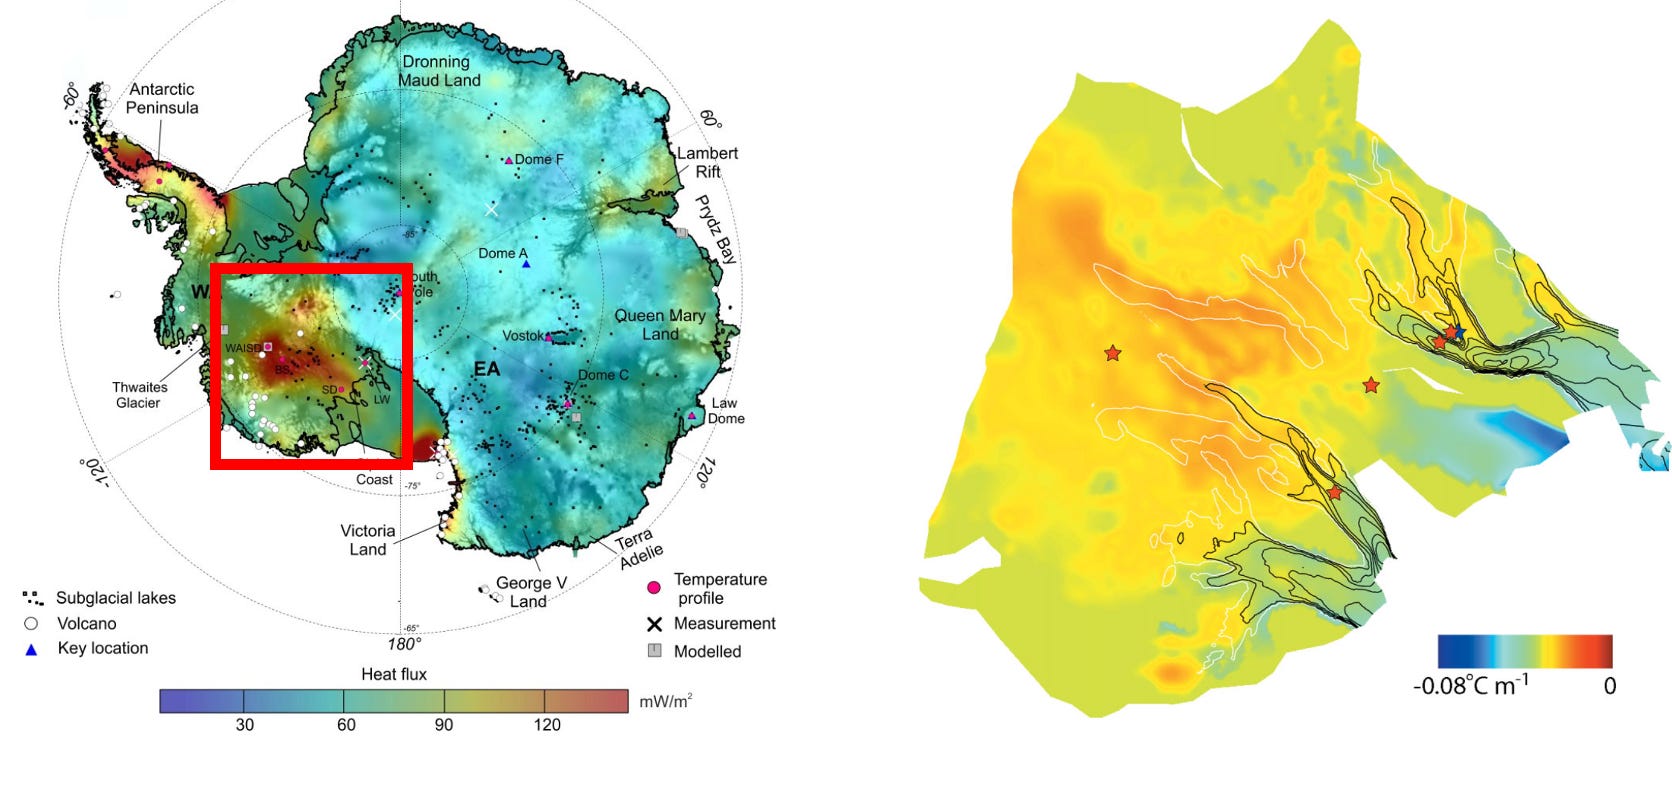
It comes as a surprise to many that subglacial lakes exist under many of Antarctica’s glaciers (above left). Geothermal heat fluxes of ~50-150 mW/m2 warm the underside of the ice sheets. This heat energy often cannot be effectively transmitted through the overlaying, insulating ice sheet to the cold surface without melting the basal portions of the glacier. Any basal meltwater will flow downhill if possible, carrying its heat energy with it in a process termed horizontal advection. Basal water layers also act as a lubricant by reducing the friction between the glacier and its underlying sediments to the point when a glacier starts to move downslope, causing additional shear heating at the glacier base.
These processes explain the Antarctic Ross glaciers’ movements, as well as their basal temperature gradients[3]. The upstream glaciers (upper left of the right figure) move slowly: only the ~150 mW/m2 geothermal heat flux generates basal meltwaters, (no upstream advected heat, no to low shear heating). These upstream meltwaters flow downhill to join the meltwaters of the downstream glaciers, whereby their horizontal heat advection causes the downstream glaciers’ speed to increase, thereby also increasing shear heating in a positive feedback loop. However, if the heat flux underlying the upstream glaciers should decrease then their horizontal advection contributions will decrease, and their downstream glaciers’ speed and shear heating will decrease in a negative feedback loop. The latter is apparently what’s was happening in 2004, as the Ross glaciers’ speeds were decreasing due to a negative heat gradient, whereby the basal meltwaters re-freeze and the glaciers slow[3].
Geothermal activity in Western North America LGM - 14,690 BP

The geothermal potential map of Canada (above) indicates that the CIS, the SZ, and the western part of the LIS overlay broad geothermal heat anomalies. The SZ roughly followed the western boundary of the yellow area (warm sedimentary basins) of the Interior Plains and the eastern boundary (deep purple) of the Cordillera, the Canadian Rockies.
Mount St. Helens, a volcano located in the southwestern corner of Washington State, was active during its “Couger Stage” (20,500 - 18,000 BP) as well as its "Swift Creek Stage" (16,000–10,500 BP), indicating the Washington State - western Canada area experienced severely elevated heat fluxes during these periods.
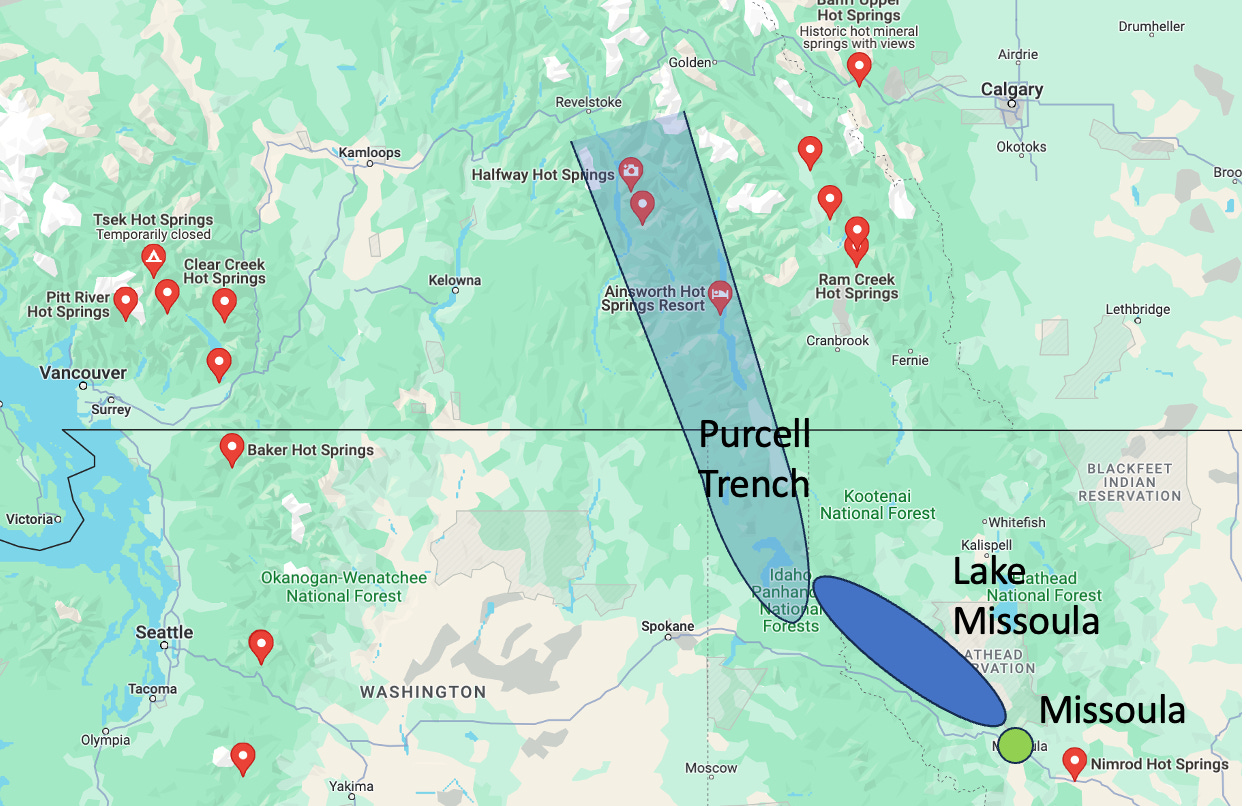
Present-day thermal spring locations indicate that a Purcell Trench glacier would have overlain a high geothermal heat flux area. The glacier advanced southwards around the start of the “Couger Stage” (20,500 BP) in response to increased basal melting due to the elevated geothermal heat flux, thereby damming Lake Missoula around the start of the megafloods (20,000 BP). Similarly, elevated geothermal heat fluxes very likely caused the basal melting of the central CIS glaciers and western LIS glaciers, causing them to rapidly advance downslope towards the SZ.

Simulations of the paleo-subglacial meltwaters and their drainage pathways (above) indicate most of these subglacial meltwaters flowed to glacial Lake Missoula.

The figures above indicates FIP and OD water drainage patterns ran very differently than today. Presently any rainfall near Livingstone Lake will flow towards either the Beaufort Sea or Hudson Bay. During the FIP and OD these routes were mostly blocked by ice sheets. Much of the central CIS and western LIS meltwaters therefore flowed southwards along the suture zone, and into Montana near the Triple Divide Peak. From there the meltwaters presently would have flowed into the Missouri River, though for most of the OD this path was blocked by glaciers, so the meltwaters filled glacial Lake Missoula.

For a brief period around 15,500 BP a LIS retreat freed the course of the Missouri, and the meltwaters could flow via the Missouri-Mississippi to the Gulf of Mexico, where a previous post indicated they caused a sea surface temperature decrease.
The Lake Missoula Floods
LIS and CIS meltwaters flowed into ice-dammed Lake Missoula, where they slowly via horizontal advection melted their way through the Purcell Trench Lobe glacier. The melting very likely occurred via cracks and fissures, weakening the structural strength of the glacier to the point of a catastrophic dam burst.
Summary
An elevated geothermal heat flux during the FIP and OD very likely created the dam and generated the floodwaters of the Lake Missoula megafloods. The basal parts of the CIS and LIS glaciers melted, which in turn caused:
the Purcell Trench Lobe to advance to the south, thereby damming Lake Missoula
huge volumes of CIS and LIS meltwaters to flow to Lake Missoula
The horizontal advection of meltwater heat caused glaciers along the SZ pathway to melt and retreat, establishing a interglacial steady-state corridor in central Canada.
References:
[1] O’Connor, Jim E. et al., 2020, The Missoula and Bonneville floods—A review of ice-age megafloods in the Columbia River basin., Earth-Science Reviews, 208, 103181.
[2] Lacelle, D., et al., 2018, Buried remnants of the Laurentide Ice Sheet and connections to its surface elevation. Sci Rep 8, 13286, https://doi.org/10.1038/s41598-018-31166-2
[3] Joughin I. et al., 2004, Melting and freezing beneath the Ross ice streams, Antarctica. Journal of Glaciology, 50, 96-108. doi:10.3189/172756504781830295
[4] Grasby, S. et al., 2012, Geothermal Energy Resource Potential of Canada, Geological Survey of Canada, Open File 6914 (revised), 322 p., doi:10.4095/291488
[5] Livingstone, S. et al., 2013, Modelling North American palaeo-subglacial lakes and their meltwater drainage pathways, Earth and Planetary Science Letters, 375, 13-33, https://doi.org/10.1016/j.epsl.2013.04.017.