


Numerous theories exist on what caused our current interglacial. Most explanations greatly oversimplify the cause to a “temperatures increased, so ice melted”, and fail to consider when, how or why the ice melted where it did, and why it didn’t somewhere nearby. For example, during the Oldest Dryas some ice sheets melted vigorously in both the Northern Hemisphere (e.g. western Canada) and in the Southern Hemisphere (Patagonia), while others didn’t and still haven’t (Greenland, Antarctica) .
Does Earth default to glacials?

Antarctica temperature data (above left) seem to indicate that glacials last much longer on average than interglacials. But Antarctic temperature data are not indicative of global temperatures: a previous post showed that during the Younger Dryas Antarctica warmed, Greenland cooled, and global temperatures dropped slightly. The right graph, Imbrie et al’s 2006 SPECMAP data, provides a more globally representative view of the temperature variations during the last 5 interglacial-glacial cycles, and demonstrates that the temperature proxy was above average roughly 50% of the time, consistent with the way averages are defined. More interesting is that the temperature proxy appears to alternate between 50 ka periods of ~1 and ~-1. A more practical definition for an interglacial is therefore a period when temperatures were globally above average, and land ice cover was less than average (∂18O < 0).
The glacial status quo

The cartoon above demonstrates how the energy exchanges between a melting onshore and its almost freezing offshore can on balance result in an energy loss and a return to glacial ice-cover conditions: Earth is often better at losing than accumulating energy due to the negative radiative forcing over high-latitude ice sheets.
The abrupt termination of a glacial therefore requires an energetic “disruptor” of the glacial status quo, a physical process that globally causes a step-change in heat. The 100 ka (ka = 1000 years) periodicity of the temperature graphs above reveals this disruptor is almost certainly being modulated by cyclical changes in the Earth’s orbit (orbital forcings).
Milankovitch Cycles
In the 1920’s Milutin Milanković hypothesized that Earth’s orbital variations cause changes in solar insolation (solar irradiation) that in turn drive climate changes. These orbital variations include:
eccentricity (mainly ~405 ka periods, but also ~95 ka and ~124 ka)
axial tilt (~41 ka periods)
precession (~25.7 ka periods)
Legions of researchers over the past 100 years have tried - and failed - to tie these orbital variations to Northern Hemisphere (NH) solar insolation variations that peak at the Last Glacial Maximum (LGM). Cycles with shorter periods (tilt & precession) have the greatest effect on local solar insolation, but would cause more frequent interglacials than what is observed. Combining all forcings into a single insolation model also brings no joy. Muller and MacDonald[1] summarize the problem:
the abrupt termination of the ice ages preceded warming from insolation, an effect we refer to as ‘‘causality problem.’’
In other words, (combinations of) Milankovitch cycles don’t cause a step-change in NH solar insolation around the time of the LGM.

The graph above is fairly typical: the slow change in Earth’s orbital variations causes a gradual multi-millenial change in NH solar insolation, while the abrupt termination of the glacial status quo requires a forcing that was highly disruptive around the time of the LGM (22,000 BP). It’s evident that NH solar insolation variations could not have caused the melting discussed in the previous posts, e.g. the Lake Missoula megafloods that peaked around 18,500 BP (attributed to geothermal melting) or the New York glaciers around 19,000 BP (attributed to increased Atlantic ocean heat) or the “stepped warming” in the Southern Hemisphere (SH) that rapidly melted the Patagonia ice sheet between 17,500 - 17,150 BP[3]. The graph above does indicate that solar insolation plays an important role as “pacemaker”[4]: once a glacial is abruptly pushed into an interglacial the increasing solar insolation prevents a return to the glacial status quo.
Note that some authors claim interglacials are caused by orbital eccentricity (OE) variations, an idea that was robustly debunked by Muller and MacDonald[1]:
OE variations result in solar insolation changes that are far too small to be significant
OE’s main period is ~400 ka rather than ~100 ka; 400 ka cycles are absent in most climate records (see graphs below)
a full resolution spectral analysis of climate records
shows that the 100-kyr period is a single, narrow peak, a simple pattern that strongly confirms an astronomical origin
In other words: solar insolation variations didn’t cause the current interglacial, which in hindsight is unsurprising: due to ice’s high albedo only 10-20% of any (small) solar insolation increase is absorbed, while a true disruptor must cause a vigorous melt and a swift retreat of the ice cover, after which the solar insolation pacemaker can cause further vigorous melting.
Orbital inclination - the forgotten orbital forcing
The invariable plane of our solar system is a plane perpendicular to the angular momentum vector of the solar system, which is approximately equal to the orbital plane of Jupiter. Muller and MacDonald[1] demonstrate that orbital inclination (OI) variations in the invariable frame generate cycles with 100 ka periodicity that match temperature cyclicity very well (see graphs below), so conclude that OI drives glacial cycles. Zhou et al.’s[5] cross-wavelet spectrum between Asian monsoon rainfall and geomagnetic field strength similarly exhibits a strong coherency at the ~100 ka period, but only minor, perhaps insignificant coherency at classic Milankovitch insolation frequencies, despite their climate records showing distinct 23 ka (precession) periods.

At this point many will be thinking that this type of reasoning is piling heresy (OI forcing) on top of heresy (solar insolation variations don’t cause interglacials) on top of heresy (orbital forcings drive geomagnetic field variations). But the evidence is undeniable: Earth’s global average surface temperature, Asian monsoon rainfall and geomagnetic field variations show a strong 100 ka periodicity that almost certainly was caused by OI variations, while there is no plausible explanation on how solar insolation changes can modify the geomagnetic field.
Orbital Inclination Forcing
In the invariable frame Earth’s OI variations follow a 100 ka period whereby its values cycle between ~1º and ~3º[1], implying that its forcing reverses (changes sign) at its minima and maxima, 1º and 3º resp.: OI forcing reverses when Earth’s orbital inclination shifts from approaching the invariable plane (3º → 1º) to moving away from it (1º → 3º), and vice versa.

A plot of Muller and MacDonald’s[1] temperature proxies demonstrates that the switch from approaching the invariable plane to leaving it (blue lines; OI = ~1º, local minimum) is followed by a 50 ka period of cooler temperatures, while a warmer period follows the switch from leaving to approaching (red lines; OI = ~3º, local maximum). Temperature variations therefore follow a rectangular function (step function): OI forcing causes 50 ka periods of warming and cooling. Note the Muller and MacDonald’s 1997 SPECMAP version was updated by Imbrie et al. in 2006, but that the updated version shows similar fluctuations and is based on more and better data.

Geomagnetic intensity and global temperature graphs (above) both show a strong 100 ka periodicity, with peaks lagging OI peaks by either a 1/4 period (temperature) or a 1/8 period (geomagnetic intensity).
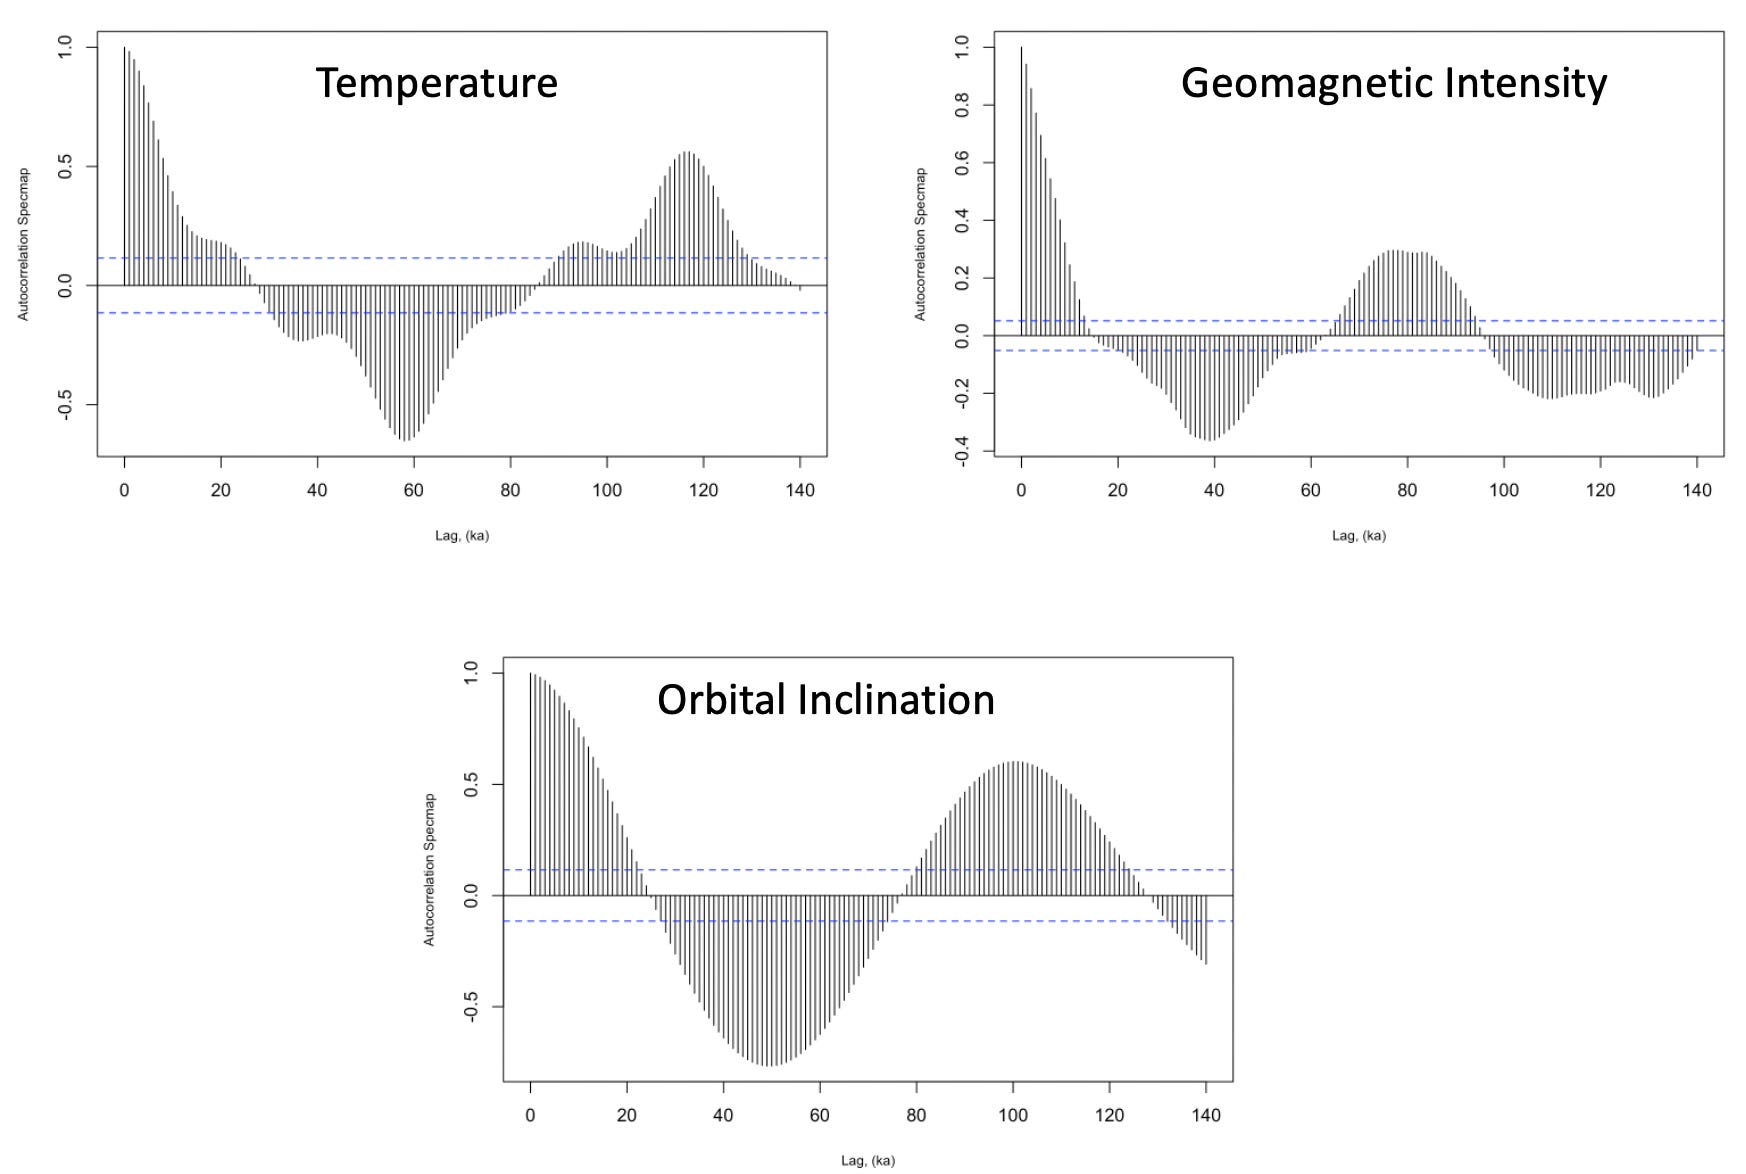
The autocorrelation of the SPECMAP data confirms the data resembles a 50 ka step function: significant positive autocorrelation for lags up to 20 ka, and significant negative autocorrelation for lags between 30 ka and 70 ka, with the switchover around 25 ka (1/4 period). The temperature data behave as a 100 ka period step-function with discontinuities every 50 ka that are concurrent with the OI minima and maxima. OI peaks and troughs follow a predictable 100 ka period cosinusoidal function. The geomagnetic intensity data follow a fairly complex 12.5 ka (pos) + 37.5 ka (neg) + 12.5 ka (neg) +37.5 (pos) period function, which is the result of a multivariate OI dependency (see below).

Cross-correlation plots (above) reveal that temperatures lag the OI by 25 ka: the temperature highs (interglacials) occur middle in the period when OI is decreasing from ~3º to ~1º. The geomagnetic data show a more complicated relationship with OI, due to a dependent variable - Outer Core temperature (see next post)- also covarying with OI. This causes the geomagnetic intensity peaks to precede the OI peaks by a 1/8 cycle (12.5 ka) and its troughs to precede OI troughs by 12.5 ka, resulting in a phase-shifted 12.5 + 37.5 ka period cyclicity.
The solar wind and solar particle events - the forgotten solar power source
Solar insolation is by far the most powerful energy source that reaches Earth, which is why many climate modelers habitually ignore all other energy sources. Other significant solar power sources include:
The solar wind, a sun-emitted stream of charged particles that delivers a fairly constant average Earth-incident 4 - 6 TW of power
Solar particle events (SPE), some of which delivered estimated power pulses of up to 30,000 TW during the OD. Powerful Earth-incident SPE’s occurred around 18,600 years ago (start Oldest Dryas) , 14,800 BP (start Bøllling-Allerød) and 17,600 BP, around the time of the “stepped warming” that occurred in Patagonia.
Solar wind and SPE power largely consists of the momentum and magnetic energy of their charged plasma stream particles. Their flowpaths mainly follow the heliomagnetic field lines, whose interplanetary azimuths and incidence angles fluctuate (figure below) around and in the solar equator plane that itself is at a ~7º angle to the invariable plane[9]. Average Earth-incident SPE and solar wind energy would therefore be maximal if Earth’s orbit was wholly in the solar equator plane, but would be significantly reduced if Earth had an orbital inclination of 90º. An increasing OI - away from the solar equator/invariable plane - therefore reduces incident solar wind and SPE power, while a decreasing OI - towards the plane - increases incident power. Next week’s post discusses how these power variations cause geomagnetic field strength, geothermal heat flux and surface temperature variations.

Other proposed causes of interglacials
At this point many readers will be thoroughly disappointed that their favorite theory on the cause of the last glacial period end has not been discussed. Most of these theories depend on solar insolation variations pushing Earth’s climate into an interglacial, although the above discussions demonstrate that such a reliance is incompatible with the undeniable OI forcing. Vieira et al. 2012[10] claim:
the maximum change in the average TSI [due to OI forcing] over timescales of kyrs is 0.003 Wm-2
. For completeness’ sake:
Ocean currents: ocean currents played an important role during the melting of the ice sheets as a horizontal advector of cold and warm, as will be discussed in future posts. But a change in horizontally advected heat requires either a large change in albedo or solar insolation around the time of the LGM, so in essence requires an additional end-of-glacial cause.
Cosmic Rays: a theory proposed by Kirby in 2004, who agrees that orbital forcings are responsible for glacial cycles, and also agrees that the classic Milankovitch cycles and solar insolation are not responsible. He attributes the end of the last glacial period to variations in cosmic rays (modulated by the heliomagnetic field) and their effect on cloud formation. The theory relies on three speculative and contentious assumptions:
Abrupt step changes in cosmic rays occurring with 100 ka periodicity
Cloud formation is affected by cosmic ray variations
Increased cloud formation causes global warming. Clouds reflect solar insolation energy, but also help retain Earth-surface emitted thermal energy, and as such have been invoked as the possible cause of both the beginning and end of glacial periods. A recent study indicates that clouds[7]
have a large net cooling effect on the planet
so are an unlikely cause of an interglacial.
Dust: this idea was popularized by Ellis and Palmer[3] in 2016. It relies on four highly speculative assumptions: 1) that a reduction in atmospheric CO2 caused a massive areal die-back of plants, mainly at high altitudes, 2) that this plant die-back caused desertification, 3) that winds transported desert dust onto the ice sheets, and 4) that this dust caused an albedo decrease that caused melting.
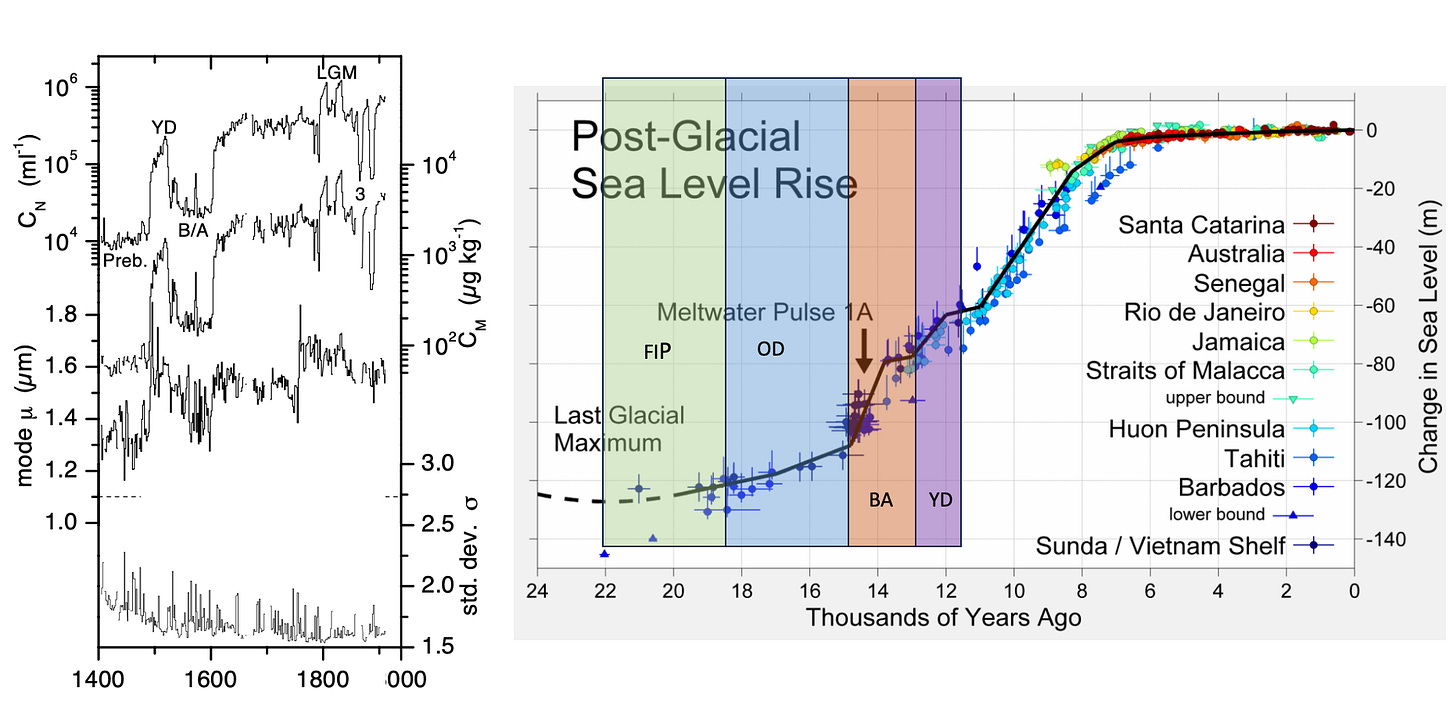
Left: Profiles of microparticle (dust) concentration. Source: [6]. Right: Sea Level Rise Curve. Source: Wikipedia

Ruth et al. [6] however show a 100-fold decrease in dust concentrations from the LGM (1 ppm) to the Holocene (10 ppb; 1 µg/kg = 1 ppb), indicating dust concentrations are inversely proportional to melting. For example, the large Bølling-Allerød “Meltwater Pulse 1A” occurred when dust levels were around 10 ppb, a concentration that is multiple orders of magnitude too low to have an impact on ice albedo.
CO2

Atmospheric CO2 versus age.Top: last 800 ka (Source: [3]), Bottom: Since LGM (Source: [8]) Red: Antarctic temperature. Blue: global composite temperature. Yellow: CO2. A too perfect correlation exists between atmospheric CO2 and Antarctic temperature, while very poor correlations exist between CO2 variations and most other parameters: global temperatures, Greenland ice temperatures, sea level rise, melting events, etc. Additionally, no step change occurs around the time of the LGM, and CO2 increases were minimal at the time of the large-scale melting in Patagonia or Western Canada. Shakun et al.[8] agree that:
CO2 did not initiate deglacial warming

so atmospheric CO2 in effect also likely functioned as a “pacemaker”.
A previous post documented that ocean warming around the time of the LGM caused Antarctic sea ice cover to melt and Antarctic onshore temperatures to rise. A recent study has shown that sea ice helps remove CO2 from the atmosphere, or conversely release CO2 during melting, suggesting that Antarctic sea ice melting drove CO2 increases rather than vice versa, or that the CO2 measured in Antarctic ice core gas bubbles represents the volume of calcium carbonate crystals that formed at the time of ice formation.
Summary
Orbital Inclination Forcing drives the glacial - interglacial cycles. Temperature, climate cycles and the geomagnetic field strength covary with the 100 ka Orbital Inclination cycles. The next posts will demonstrate that geothermal heat flux variations also covary with the Orbital Inclination cycle.
References
[1] Muller, R. and MacDonald, G., 1997, Spectrum of 100-kyr glacial cycle: orbital inclination, not eccentricity. PNAS, 94, 8329-34 .
[2] Williams, C.,et al., 2010, Deglacial abrupt climate change in the Atlantic Warm Pool: A Gulf of Mexico perspective, Paleoceanography, 25, PA4221, doi:10.1029/2010PA001928.
[3] Ellis, R. and Palmer, M., 2016, Modulation of ice ages via precession and dust-albedo feedbacks, Geoscience Frontiers, doi: 10.1016/j.gsf.2016.04.004.
[4] Hulton, N. et al., 2001, The Last Glacial Maximum and deglaciation in southern South America. Quaternary Science Reviews, 21, 233-241, 10.1016/S0277-3791(01)00103-2.
[5] Zhou, W. et al., 2023, Eccentricity-paced geomagnetic field and monsoon rainfall variations over the last 870 kyr, PNAS, 120, https://doi.org/10.1073/pnas.2211495120
[6] Ruth, U. et al., 2003, Continuous record of microparticle concentration and size distribution in the central Greenland NGRIP ice core during the last glacial period, J. Geophys. Res., 108, 4098, doi:10.1029/2002JD002376, D3.
[7] Ramanathan V. and Inamdar, A., 2006, The radiative forcing due to clouds and water vapor. In: Kiehl JT, Ramanathan V, eds. Frontiers of Climate Modeling. Cambridge University Press, 119-151.
[8] Shakun, J. et al., 2012, Global warming preceded by increasing carbon dioxide concentrations during the last deglaciation. Nature 484, 49–54, https://doi.org/10.1038/nature10915
[9] Balogh, A. et al., 2008, The Heliosphere through the Solar Activity Cycle. Springer, 286 pp.
[10] Vieira, L. et al., 2012, How the inclination of Earth's orbit affects incoming solar irradiance, Geophysical Research Letters, 39, doi:10.1029/2012GL052950.