


19 - When you can't make them see the light, make them feel the heat
A warm inner glow after years of frigidity


The previous posts provide the framework for re-interpreting the events that ended the last glacial period (LGP). The following posts will start at the Last Glacial Maximum (LGM) and re-interpret the glacial melting events using the integrated geomagnetic-geothermal-surface temperature (IGGT) model.
Proposed causes of the glacial/interglacial cycles
No commonly accepted theory exists on the causes the observed 100 ka glacial/ interglacial cycles. Andersen and Borns[7] summarized the candidates:
astronomic factors
sun-spot activity
ocean currents
atmospheric composition
volcanic dust or dust from disintegrated meteorites in the atmosphere
surges of the Antarctic Ice Sheet
rising and falling of parts of the earth's crust
solar-terrestrial magnetic coupling
fluctuations of the upper atmospheric jet-streams
asteroid impacts
interaction between ocean currents and atmospheric circulation.
and tossed in a bonus "snowblitz" theory, which suggests a series of harsh winters and cool summers started the glaciations. They warn that:
objections have been presented against all of these theories, and many of them have been rejected outright as very unlikely.
They concluded that the theory that seems to fit the patterns best is the “astronomic Milankovitch theory”, but stated that “two serious objections have been raised” against it:
First of all the theory requires glacial and climate fluctuations in the northern hemisphere to be out-of- phase with the fluctuations in the southern hemisphere. Most field observations indicate that this is probably not the case, and that in fact the fluctuations are in phase in both hemispheres. Second, the calculated changes in energy-input to the earth's atmosphere and the earth's surface caused by the Milankovitch- predicted changes are too minor as compared to the magnitude of the actual changes.
The first objection reveals the astronomic forcing must have a global effect, one that is not just limited to a single hemisphere. Previous posts have documented that Orbital Inclination variation is the astronomic forcing that best matches the 100 ka period cyclicity. It mainly varies Outer Core energy, which in turn causes global geomagnetic and geothermal variations, thereby voiding the first objection. The second objection - that these variations are too small to cause climate change - is applicable to Milankovitch forcings that vary solar insolation, but was countered in the previous posts on Orbital Inclination Forcing, and will be further rendered moot in this and following posts.
Sorting A & B’s list[7] into categories:
Events that supply energy and that can force cyclical climate change: 1,2,8
Events that can redistribute cyclically-supplied energy: 3,4,6,9,11
Events that cause temporary fluctuations but not cyclical climate change: 5,7,10
The following posts explain how the first set supplied the energy that varied the second set over the 22-10 ka period, while largely ignoring the third set.
When was the Last Glacial Maximum?
A previous post arbitrarily picked a WDC ice core temperature proxy low at 22 ka as the LGM. The IGGT model indicates the theoretical LGM occurred much earlier, at the time of the Orbital Inclination maximum at ~32 ka. However, shorter-term solar cycles become increasingly important sources of solar insolation and incident SPE and solar wind power variations for events at 1000 year (ka) time scales: the long period 100 ka Orbital Inclination cyclicity (bullet point 1) forced the glacial-interglacial transition, while shorter period solar cycles (bullet points 1, 2 & 8) significantly impacted short-term periods of glacier growth and melt.
A 2009 study[1] places the LGM between 33-26.5 ka: most ice sheets reached their maximal extent between 33 -29 ka, while the rest reached theirs slightly later but before 26.5 ka. The authors conclude the LGM was followed by a ~7000 year period (26.5 - 19 ka) of relative stability characterized by a fairly constant relative sea level low. Most large ice sheets only began to retreat from their maxima “between 19 and 20 ka”[1], indicating the end of the LGP postdated the LGM by ~7 millennia.
Orbital Inclination Forcing
The previous paragraph confirms Orbital Inclination (OI) Forcing’s role in extending the LGP up to the Orbital Inclination maximum at 32 ka BP. The IGGT model predicts that the Outer Core temperature and geothermal heat flux reach their minimum 12.5 ka before the OI reaches its maximum, resulting in a geomagnetic intensity decrease due to the progressively weaker (rates of change in) SPE and solar wind energy. For the LGP, the former are confirmed by the continuing ice sheet growth in this period[1] while the latter is confirmed by the “Laschamp” geomagnetic excursion (45-40 ka) in the graph below.

The rate of increase in Outer Core temperature and geothermal heat flux is maximal when the OI rate of decrease is maximal, that is 1/4 cycle (25 ka) after the OI maximum (32 ka BP) at 7 ka BP. This peak in OI geothermal heat forcing concurs exactly with the peak in the temperature proxies from Icelandic lake sediments documented in the previous post, confirming that OI Forcing and geothermal heat variations very likely play a significant role in Icelandic surface temperature variations.
But what about the end of the LGP / start of the interglacial around ~19 ka[1]? The graph above indicates that geomagnetic field strength started significantly decreasing - and therefore Outer Core temperatures and geothermal heat flux significantly increasing - around 19 ka, that is roughly 1/8 OI period (12.5 ka) after the OI maximum. This concurrence may be fortuitous, so the following sections looks at whether the other main positive forcing, Solar Irradiation Forcing, could have plausibly initiated the 19 ka melt.
Solar Irradiation Forcing
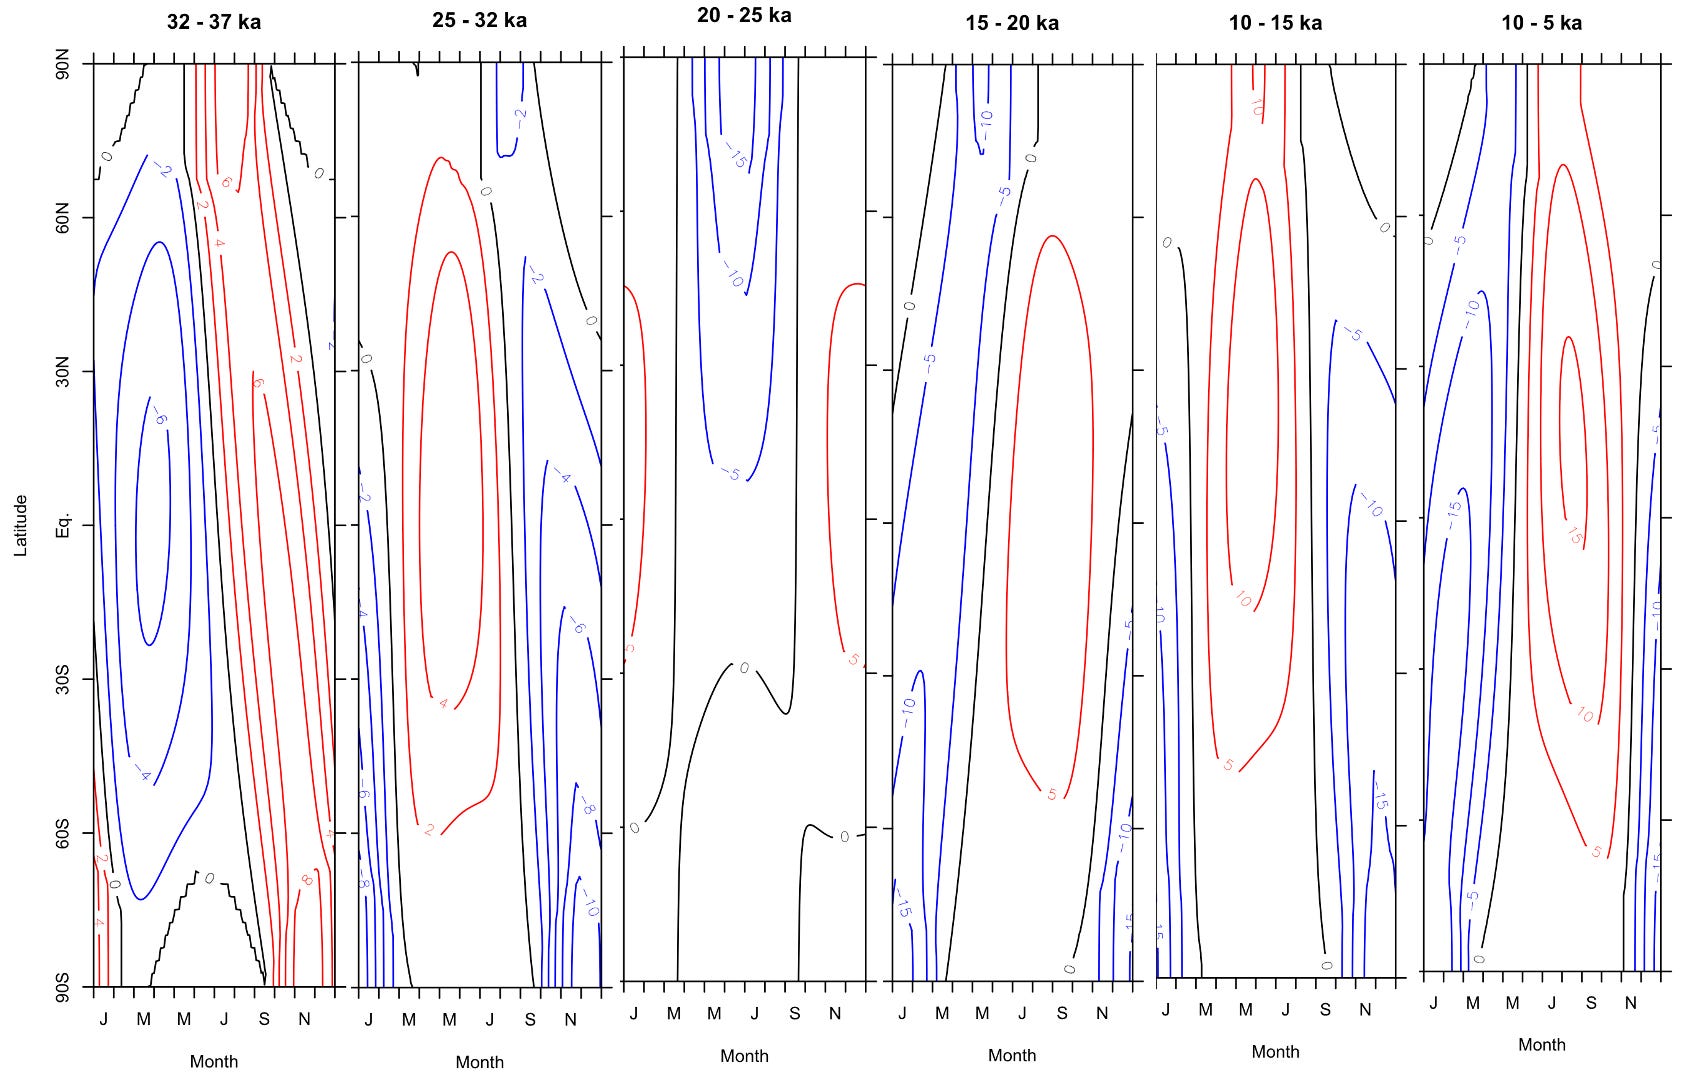
A quick look at Earth’s spatiotemporal solar insolation variations around the time of the end of the LGP, based on the authoritative work of Laskar et al. (2004), indicates that these variations likely did not play a decisive role in local glacial melting until around 10-15 ka, when the Northern Hemisphere (NH) enjoyed increases of up to 10 W/m2 in its summer months.
Summer solar insolation power was increasing in the run-up to the 32 ka OI maximum in both the NH and Southern Hemisphere (SH): increases of up to 8 W/m2 during the NH and SH summer melting months were apparently insufficient to reverse the observed glacial advances[1]. High-latitude solar insolation variations were minimal in the run-up to the large-scale NH and SH melting that started around 19 ka, a fact that has been documented in several previous posts. Solar insolation maps for the 19-20 ka period (below) indicate that decreases in high-latitude solar insolation of up to ~3 W/m2 occurred during the NH and SH summer melting seasons. Solar insolation variations therefore almost certainly did not initiate the end of the LGP.

A reconstruction of the 32-19 ka period

A quick look at the geomagnetic intensity autocorrelation functions for the 8-1 ka BP data (older data become progressively poorer-quality) reveals 2200/4400 year, 1000/2000 year (not shown) and 200/400 year cyclicities similar to the Bray, Eddy and Grand solar cyclicities resp., indicating shorter-term solar cycles plausibly have a significant impact on Outer Core temperature, geomagnetic intensity and geothermal heat. The temperature proxy comparison graph (below) also shows striking 1 - 12.5 ka period cyclicities during its 60-30 ka interval. Unravelling the solar from the orbital forcings for these Late Glacial shorter period cycles requires a significant effort that goes far beyond the scope of this substack.

This post instead focuses on the events that happened around 19 ka, the commonly accepted end of the LGP / start of initial melting[1], as well as its 32-19 ka run-up.
Temperatures slowly started to increase in Greenland (NGRIP) after 32 ka, but large systemic increases only occurred during the Bølling-Allerød (14.7-12.9 ka), in concurrence with the 10-15 ka solar insolation increases mentioned above. In Antarctica (EDML, EDC, WDC) temperatures only started to slowly increase after ~26 ka, that is after the maximal glacial extent period that lasted ~7000 years[1], although large systemic increases only started around the start of the Oldest Dryas(OD; 18.5-14.7 ka). The misfit that jumped the gun by 3500 years is the WDC location.
The beginning of the end

The Atlantic Meridional Overturning Circulation (AMOC) and Southern Meridional Overturning Circulation (SMOC) near Antarctica form the Atlantic legs of the global thermohaline circulation current (GTCC; above left), the largest horizontal advector of hot and cold energy between the North and South Atlantic. The AMOC/SMOC are often cited as the tipping elements of global climate change[4]. Studies have demonstrated that the AMOC was severely weakened during the LGM[4], though the causes and mechanisms of this weakening are still being debated.
The LGM extent of the Antarctic sea ice cover (above right and below) would have severely limited the amount of wind fetch over the Antarctic Circumpolar Current, the central motor of the GTCC, and would have therefore been partially to largely responsible for the diminished the strength of the AMOC/SMOC. It would have also partially to entirely cut off the tropic/subtropic ocean “loops” that transfer heat to the Atlantic while cooling the Indian and Southern Pacific oceans. At the time of the LGM the AMOC/Gulfstream was apparently too weak to significantly warm the relatively cold climates in both Canada and Northern Europe, but was apparently strong enough to halt the (sea) ice sheet advances in the New York and Falkland Island areas.

A very likely cause of the warming that started around 22 ka in the WDC area is an increase in geothermal activity along the South Pacific spreading ridges (graph above) that caused the sea ice cover to the North and West of the WDC location to retreat, thereby causing temperatures to rise slightly in the WDC area. Other key areas such as the Drake Passage however remained covered by sea ice: South Georgia peat and lake sediment data indicate that the initial land and sea ice retreat happened sometime between 19.3-18.6 ka[6]. The map above indicates that increased geothermal activity along the South Pacific spreading ridges between 22-19 ka - and not increases in solar insolation - very likely caused the Antarctic sea ice cover retreat.
Due to sea ice cover melting along the South Atlantic ocean geothermal anomalies, by 19 ka the circum-Antarctic sea ice cover had retreated far enough to free the Drake Passage, thereby allowing increased wind fetch to jumpstart the Antarctic Circumpolar Current, the AMOC/SMOC, and the GTCC, causing a step-change in the SH to NH horizontally advected heat energy. In addition, geothermal heat flux increases along the mid-Atlantic spreading ridge (geothermal anomaly) would have significantly enhanced the formation rates of North Atlantic Deep Water and Antarctic Bottom Water[11] currents, further discussed in the next two posts.
Summary
Studies support the concurrence of LGM with the Orbital Inclination maximum at 32 ka, though some glaciers only reached their maximum extent by 26.5 ka. A 7000 year period of relative glacier and sea level stability was followed by the sudden start of intensive melting around 19 ka. This melting was almost certainly not caused by variations in solar insolation, but was very likely due to a sudden increase in geothermal heat - caused by Orbital Inclination Forcing - that caused significant circum-Antarctic sea ice cover retreat, thereby jumpstarting the global thermohaline circulation current and the Atlantic and Southern Meridional Overturning Circulations. The next post discusses the local mechanisms.
References:
[1] Clark, P. et al., 2009, The Last Glacial Maximum. Science, 325, 710-4. 10.1126/science.1172873.
[2] Channell, J. & Vigliotti, L., 2019, The Role of Geomagnetic Field Intensity in Late Quaternary Evolution of Humans and Large Mammals. Reviews of Geophysics, 57, 10.1029/2018RG000629.
[3] Laskar, J. et al, 2004, A long-term numerical solution for the insolation quantities of the Earth. Astronomy and Astrophysics, 428(1), 261–285. https://doi.org/10.1051/0004-6361:20041335
[4] Ditlevsen, P. and Ditlevsen, S., 2023, Warning of a forthcoming collapse of the Atlantic meridional overturning circulation. Nat Commun 14, 4254 (2023). https://doi.org/10.1038/s41467-023-39810-w
[5] Lynch-Stieglitz, J. et al., 1999, Weaker Gulf Stream in the Florida Straits during the Last Glacial Maximum. Nature 402, 644–648. https://doi.org/10.1038/45204
[6] Hodgson, D., et al., 2014, Terrestrial and submarine evidence for the extent and timing of the Last Glacial Maximum and the onset of deglaciation on the maritime-Antarctic and sub-Antarctic islands, Quaternary Science Reviews, 100, 137-158, https://doi.org/10.1016/j.quascirev.2013.12.001.
[7] Andersen, B., Borns, H., 1994, The Ice Age World, Oxford University Press. ISBN 978-8200218104
[8] Hofmann, M. and Morales Maqueda, M., 2009, Geothermal heat flux and its influence on the oceanic abyssal circulation and radiocarbon distribution, Geophys. Res. Lett., 36, L03603, doi:10.1029/2008GL036078.