


21- Here comes the fløød: the Bølling-Allerød
Strategic melting surges


Many mistakenly believe the Last Glacial Period (LGP) ended with the start of the Bølling-Allerød (BA; 14.69 - 12.85 ka BP), when central Greenland temperatures abruptly rose by up to 15 ºC. However, previous posts documented that the Last Glacial Maximum (LGM) occurred 12 millennia earlier and that geothermal heat increases had already caused vigorous glacial melting and large ice sheet retreats 4 millennia earlier. The last post called this Oldest Dryas (OSD) meting “Strategic”, as geothermal heat by itself only caused relatively slow glacial melting over the local geothermal anomalies. Although geothermal melting was mainly responsible for the relatively minor OSD sea level rise on the order of ~10 m, it also resulted in:
the creation of a low albedo interglacial “corridor” in western Canada
the collapse of the North American and European katabatic cold weather systems
the jumpstart of the Global Thermohaline Circulation Current (GTCC) and its Atlantic and Southern Meridional Overturning Circulations (AMOC/SMOC)
OSD geothermal heat was therefore the catalyst for the more rapid melting during the BA that resulted in a 16-25 m sea level rise over its first ~800 years.
NH Summer Solar Insolation increases

For the first time since the LGM (26.5 ka) a mid-latitude Northern Hemisphere (NH) summer solar insolation increase around the start of the BA inaugurated a period where solar energy played an increasingly important role in ice sheet melting and a return to interglacial conditions.
The North Atlantic sea ice cover retreats

After ~17 ka the North American katabatic cold weather systems dwindled and its climate warmed, the Midwest loess deposition all but ended, deciduous forest trees migrated to areas close to the ice margin, and the Laurentide and Cordilleran ice sheets began melting vigorously[4]. Early humans also very likely crossed the Bering land bridge around this time to inhabit the area.
Around the start of the BA the North Atlantic sea ice cover limit abruptly retreated to just offshore Greenland (see above), very likely due to a geothermal heat increase along the mid-Atlantic ridge near Iceland. This geothermal heat surge - perhaps fortuitously - concurred with a very large Solar Particle Event (SPE) around 14.7 ka (see future post). This sea ice cover retreat almost certainly had a significant impact on the Global Thermohaline Circulation Current (GTCC) by allowing the AMOC surface currents to further lose heat to offshore northwestern Europe and Greenland Sea weather systems, and thereby gain the density needed to strengthen the AMOC.
The Atlantic Thermohaline Circulation Currents
Thermohaline currents are driven by differences in seawater density, which in turn vary mainly with water temperature and salinity. Denser, colder waters sink to the ocean floor, while warmer, less dense waters float to the surface, thereby stratifying the ocean column into water masses, each characterized by a temperature and salinity range.
Seawater density increases when a water mass cools, or when its salinity increases due to evaporation or ice formation. Its density will decrease when heated or by fresh water influx due to rainfall, ice melting, or river entry. Thermohaline currents are very slow, with speeds on the order of 10-20 km per year, in contrast to wind-driven surface currents that move at several kilometers per hour.

When the density of a water mass increases - often due to a temperature decrease at surface - it sinks below the surface, after which its density remains roughly invariant. A temperature-salinity diagram (above & below) identifies the main present-day Atlantic Ocean water masses that cause the relatively strong Atlantic thermohaline circulation. The densest waters are formed in the Weddell Sea near Antarctica, where they flow into the Antarctic Bottom Water mass (AABW). The North Atlantic Central Surface Water (NACSW) heats along its SH to NH subtropical and tropical path to the Gulf of Mexico and eastern US coast, after which it cools and sinks in the Greenland Sea to form the North Atlantic Deep Water (NADW). At present the NACSW also sinks below the very cold but low saline Arctic Ocean waters[8]: the cooling, sinking NACSW bifurcates near the Greenland Sea, whereby one part flows to the Arctic and the other returns to the Antarctic. A strong AMOC therefore requires a warm central Atlantic current that cools in the North Atlantic while not reducing in salinity due to freshwater dilution.

Around the time of the LGM the NACSW was almost certainly denser than today, as it was almost certainly more saline and ~5-8 ºC colder. As the North Atlantic Deep Water (NADW) and the Antarctic Bottom Water (AABW) were likely also more saline, but could not be much colder than they are at present, the NACSW could not cool enough to create a large NACSW-NADW density difference. Or put differently, the NACSW sank below the surface much earlier in its course than today: the AMOC was relatively weak at the time of the LGM.
Previous posts have noted that the Atlantic surface currents were jumpstarted around ~19 ka, when geothermal heat melted enough of the South Atlantic sea ice cover to allow significant wind fetch over the Antarctic Circumpolar Current, thereby also jumpstarting the AMOC and the SMOC, and warming the NACSW and reducing its density, although the relatively small NACSW - NADW density difference still resulted in a relatively weak AMOC that persisted throughout the OSD.

Around 14.7 ka a step-change in the AMOC (thermohaline) strength can very likely be attributed to a geothermal heat pulse that coincided - perhaps fortuitously - with a large 14.7 ka Solar Particle Event. This pulse caused the abrupt retreat of the North Atlantic sea ice cover limit to just offshore Greenland, which allowed the NACSW to further cool in the Norwegian and Greenland seas before sinking, and very likely increased its flow under the Arctic Ocean. In addition, studies[7] indicate a relatively small geothermal heat flux increase on the order of 50 W/m2 along the mid-Atlantic ridge can cause:
overall warming of bottom waters by about 0.4°C, decreasing the stability of the water column and enhancing the formation rates of North Atlantic Deep Water and Antarctic Bottom Water by 1.5 Sv (10%) and 3 Sv (33%), respectively.
The 14.7 ka geothermal heat pulse was therefore directly responsible for the strengthening of the AMOC.
Large volumes of cold, low salinity meltwaters (MW in graph above) entered the North Atlantic basin during the BA. Unlike the NACSW, these waters cannot become denser by further cooling, but can only become denser by increasing their salinity through either evaporation or sea ice formation. During the BA these meltwaters therefore very likely became occasionally “density trapped” in the North Atlantic as they could not flow beneath the higher density NACSW or Arctic Ocean surface waters. They therefore occasionally became a very low density (cold, low salinity) North Atlantic water mass in their own right, causing the NACSW to sink much earlier along its course, thereby weakening the AMOC.
The European climate abruptly warms, then gradually cools

The retreat of the European ice sheet during the OSD due to geothermal melting resulted in the collapse of the katabatic wind systems that had dominated the European climate systems between the Last Glacial Maximum (LGM; 27 ka) and ~15.5 ka[4]. Faunal, floral and oxygen isotope temperature proxies all indicate that after an initial step warming at the start of the Bølling (14.69-14.05 ka), European temperatures gradually cooled towards the end of the Allerød (13.9 - 12.85 ka), with two “glacial” low temperature excursions during the Older Dryas (ORD; 14.05 - 13.9 ka) and at (unnamed) 13.3 ka[5].

The offshore Europe sea ice cover had largely disappeared by the start of the BA. The warm NACSW current could therefore warm the offshore European weather systems, which together with the increase in solar insolation during the NH summer melting seasons caused a vigorous North European ice sheet retreat during the BA. The ice-dammed Baltic glacial lake began as a set of small lakes in the southern part of the Baltic Sea basin around the start of the BA, but increased in size to reach a maximum around the end of the BA[4]. Early humans migrated into central Europe, following the migrating fauna that shifted with the floral temperate climate zones that were advancing to the north[4]
NH Temperatures abruptly increase, then gradually decrease
An early post documented the glacier growth model, whereby an ice sheet’s temperature and accumulation rates are a function of its distance to open ocean waters.
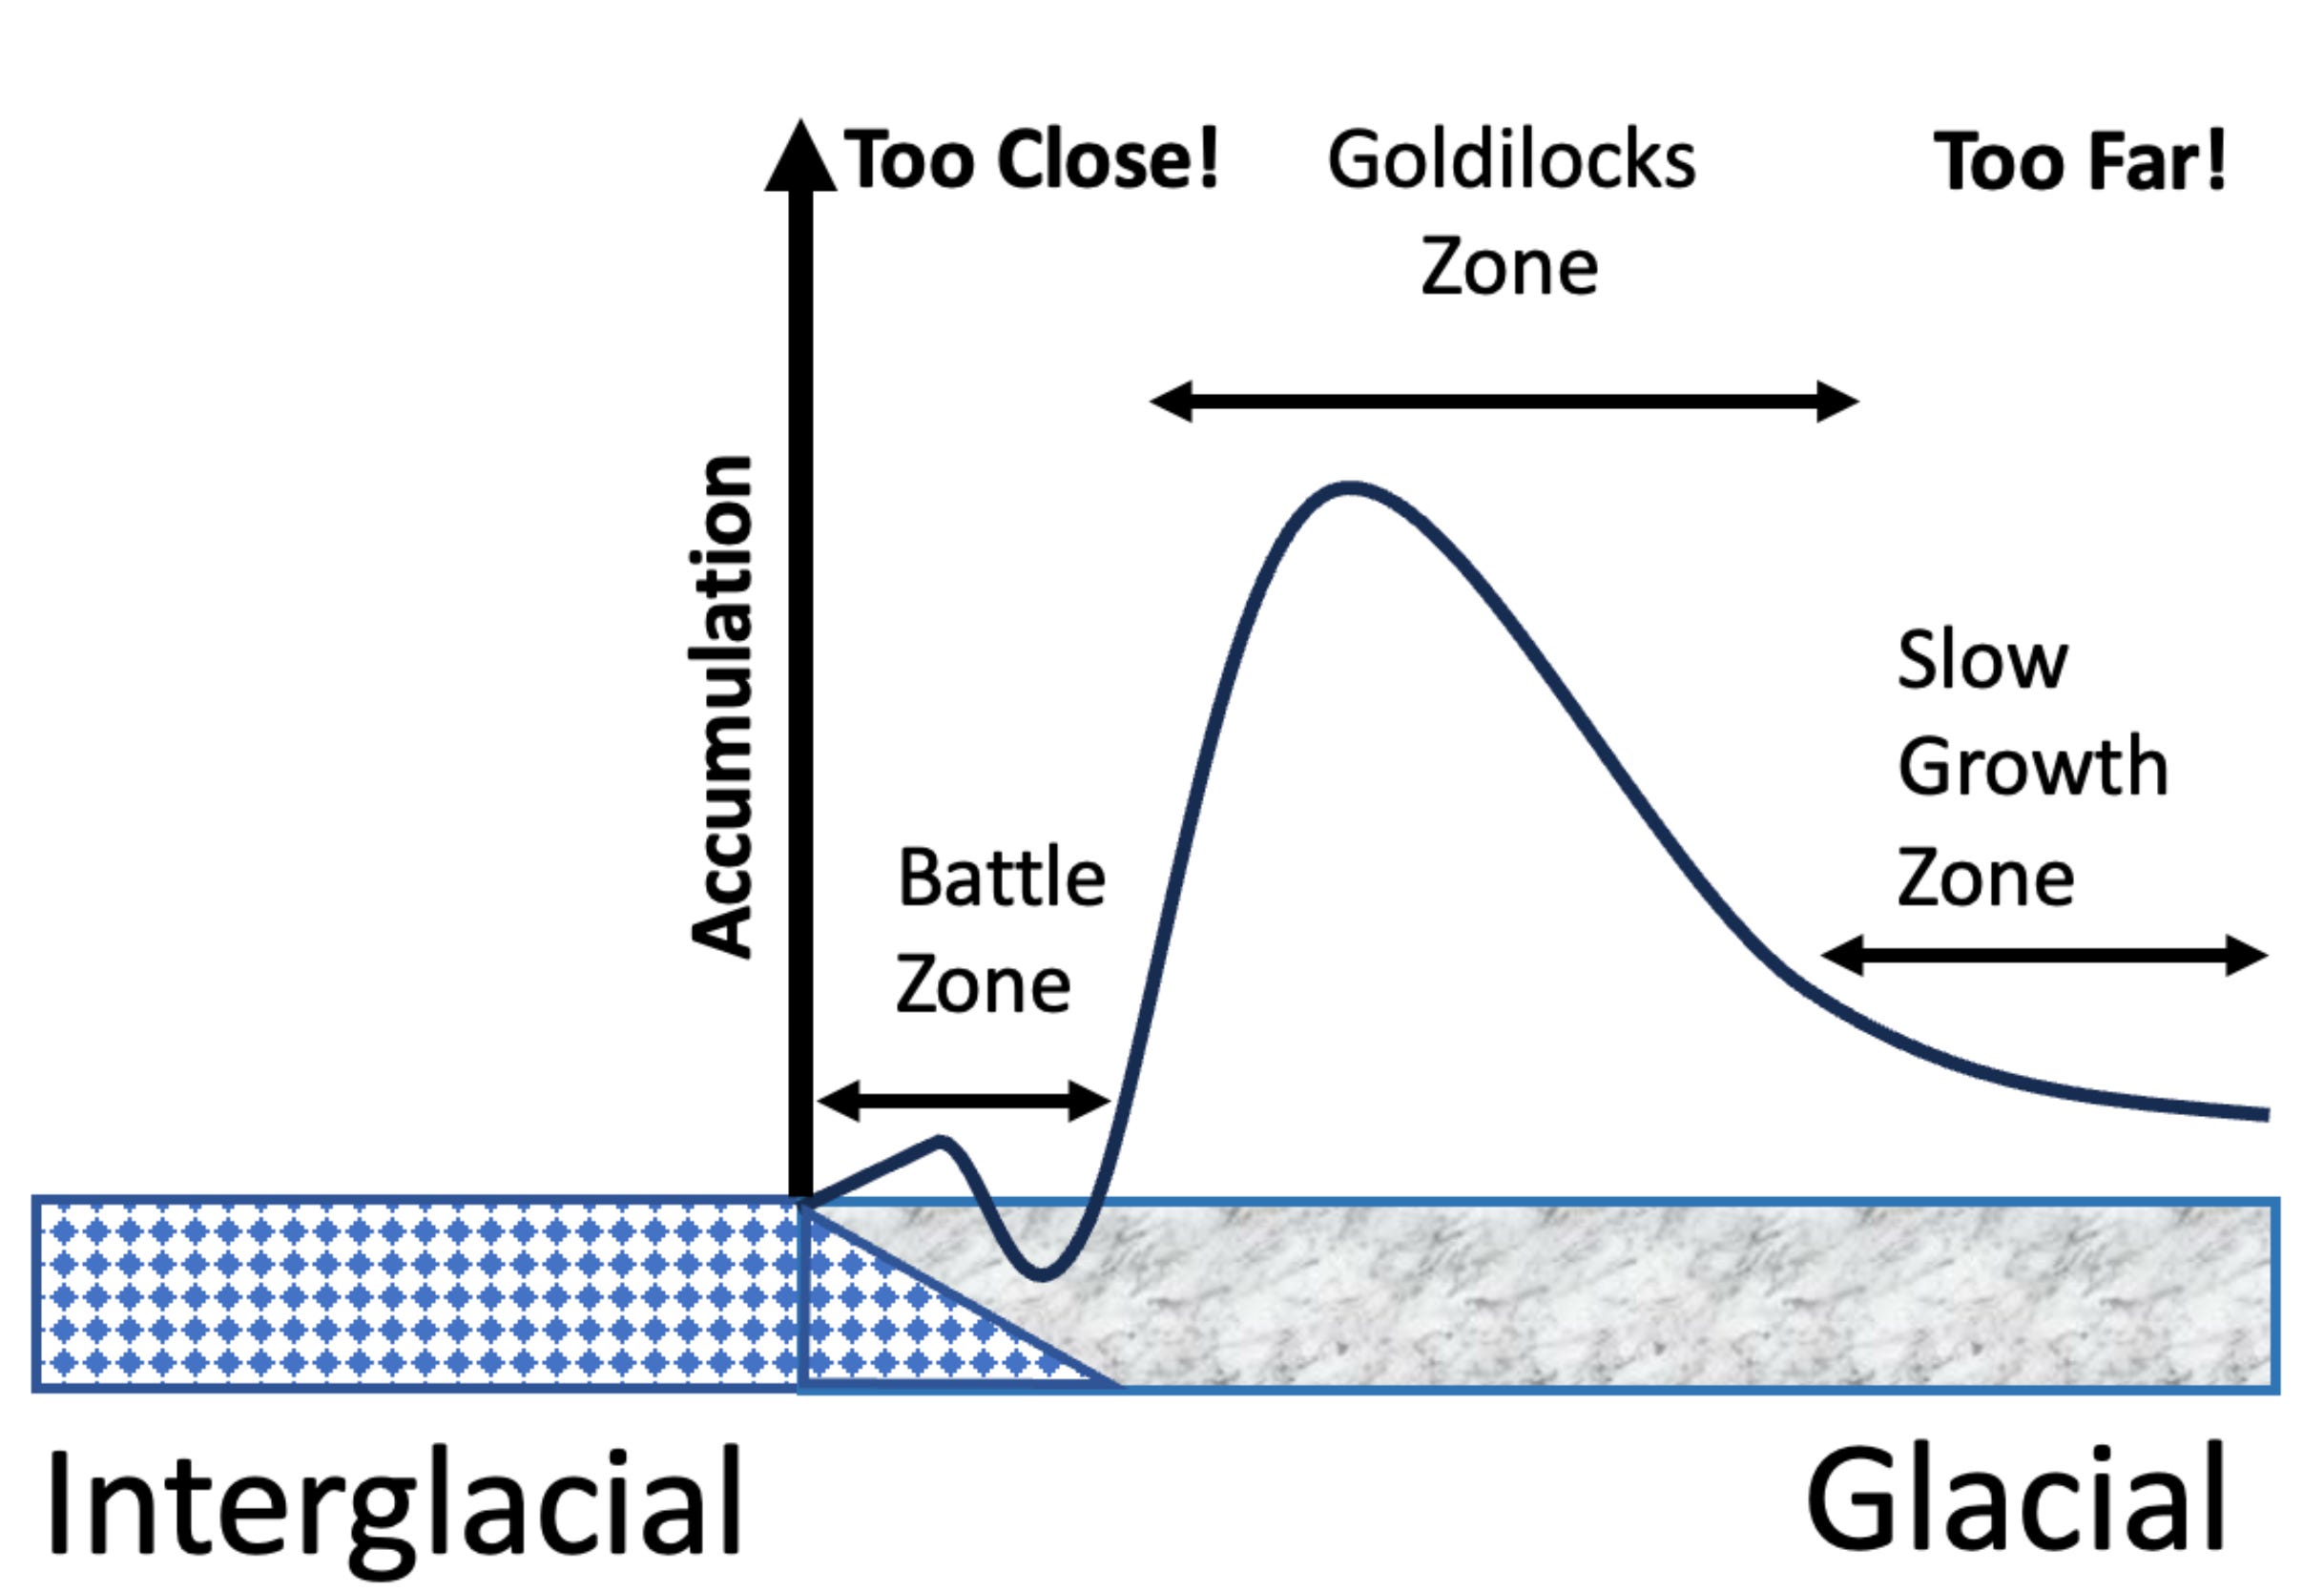
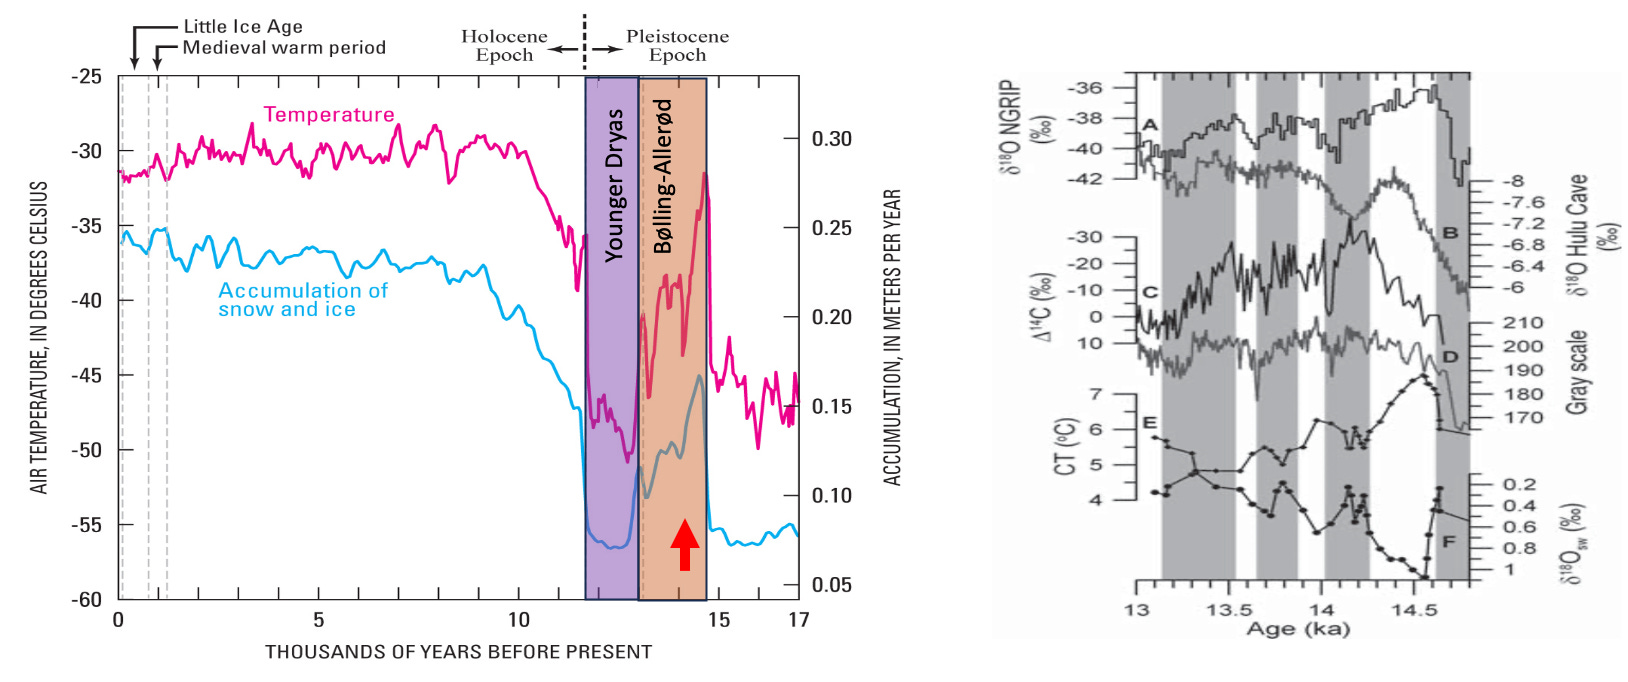
Central Greenland was almost certainly at a great distance to open oceans during the OSD: low accumulation rates and cold temperatures indicate it remained in the ”Slow Growth Zone” between the LGM and the BA. A singular drop in temperature around ~16 ka was very likely due to a drop in NACSW temperatures due to the cold meltwater influx into the Gulf of Mexico around 15.5-16 ka. Note that this had an opposite effect in the Laurentian Fan area (graphs far above): salinity and temperatures increased abruptly around ~16 ka, likely due to (exothermic) sea ice cover re-establishing itself over or near the fan, thereby locally and temporarily increasing salinity and temperature.
The abrupt North Atlantic sea ice cover melting due to geothermal heat increases around 14.7 ka abruptly reduced central Greenland’s distance to open oceans, thereby shifting it into the “Goldilocks Zone”: temperatures and accumulation rates peaked in lockstep at the start of the BA. The general temperature decrease over the BA interval was very likely the result of the gradual regrowth of the North Atlantic sea ice cover, causing both accumulation rates and temperatures to gradually decrease in lockstep, as central Greenland slid back into the Slow Growth Zone during the Younger Dryas. This gradual decrease/regrowth was interrupted by 3 very rapid sea ice cover advances during the Older Dryas, the 13.3 ka event, and the Younger Dryas. These 3 excursions follow the large interpreted eastern US fresh meltwater influxes (shaded grey in graph above) around 14.1 ka, 13.3 ka and 13.0 ka. These freshwater influxes temporarily caused the NACSW to sink below the “density trapped” low density, cold, low saline meltwater (MW) much earlier along its course in the North Atlantic. This very low density “trapped” water mass could only increase its density by increasing its salinity through refreezing, causing the North Atlantic sea ice cover regrowth, the temporary local Laurentian Fan salinity increases and the AMOC strength decreases in the graph above. Note that these meltwaters likely entered the North Atlantic via the St Lawrence seaway and not the Mississippi as Gulf of Mexico sea surface temperatures increased monotonously during the BA.

These temporary sea ice cover excursions caused distance from central Greenland and onshore Europe to open oceans to increase and their temperatures to drop: the cooler climate flora was characterized by the relative abundant occurrence of Dryas octopetalys, an indicator species of arctic-alpine regions. Note that no evidence of an “Older Dryas” flora or colder climate has been found in Britain, very likely indicating no offshore sea ice cover was preventing its warming by the NACSW: Britain remained in the Battle Zone while onshore Europe slid into the low temperature, high precipitation Goldilocks Zone. Following these sea ice cover excursions, renewed geothermal activity (numerous SPE events between 14 - 13 ka) or warm NACSW melting caused sea ice cover to retreat again, though not as far as at the start of the BA.
North American glaciers melt vigorously
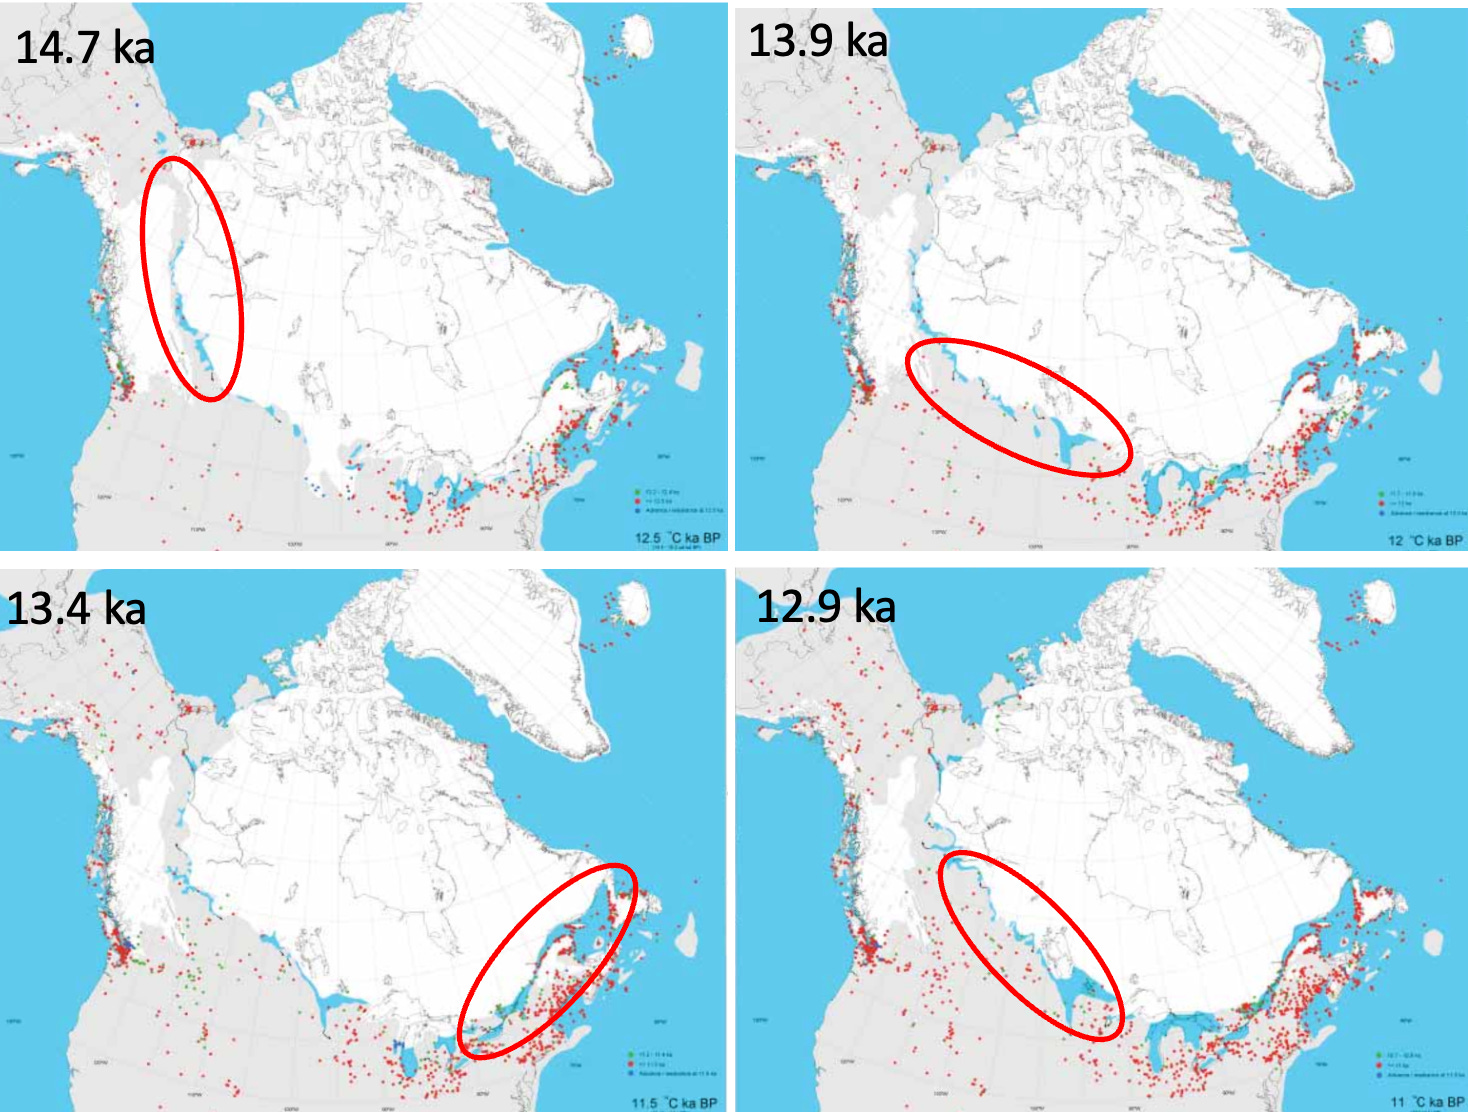
Onshore North American glacial melting was charaterized by a broadening of the OSD interglacial corridor, which acted as an expanding low albedo melting nucleus, and by the gradual opening of the St Lawrence Seaway drainage path. Towards the end of the BA the large volumes of mid-western meltwaters could no longer drain via the usual drainage paths (Mackenzie, Mississippi, St Lawrence, Iro-Mohawk/Hudson) and were therefore ponded in the glacial Lake Agassiz. By the end if the BA the northeastern US and the St Lawrence seaway were largely ice free.
SH Temperatures first increase, then gradually decrease

Antarctic temperatures first increased until ~14.2-14.5 ka, then started to progressively decrease, though without any prominent cold excursions such as the Older Dryas. Accumulation rates at coastal locations, such as the WDC location, remained relatively constant and high: the distance to open ocean remained constant, while offshore temperatures decreased. This temperature decrease is therefore consistent with the AMOC - for the first time since the LGM - returning large volumes of cold water to Antarctica, thereby cooling the Antarctic Circumpolar Current. The cooling South Atlantic temperatures caused renewed glacier growth, e.g. in South Georgia.
Assuming a 16,000 km bottom current travel distance between the NH and SH and a relatively low current speed of 12 km/year implies the cold waters arrived ~1300 years after they sank in the North Atlantic around ~16 ka. The South Atlantic cooling could therefore be plausibly due to the cold meltwater influx into the Gulf of Mexico between 15.5-16 ka, although this remains highly speculative.
Summary
The BA step-change in central Greenland temperatures and AMOC strength was very likely caused by a North Atlantic sea ice cover retreat due to a step change in geothermal heat around 14.7 ka. Increasing solar insolation during the NH summer melting season, increasing AMOC surface current temperatures, and the large sea ice cover retreat at the start of the BA all combined to force vigorous North American and European ice sheet retreats. Large meltwater pulses around 14.1 and 13.3 ka caused AMOC strength decreases and North Atlantic sea ice cover advances, which in turn caused Northern European and Greenland temperature and accumulation rate decreases.
References
[1] Simakova, A. & Puzachenko, A., 2005, Palaeovegetation of Europe during the Bölling-Alleröd interstadial complex warming (12.4-10.9 ka BP). Polish Geological Institute Special Papers. 16. 116–122.
[2] Dyke, A., 2004, An outline of North American deglaciation with emphasis on central and northern Canada. Developments in Quaternary Sciences.,
[3] Hughes, A. et al., 2015, The last Eurasian ice sheets – a chronological database and time-slice reconstruction, DATED-1. Boreas, 45, 10.1111/bor.12142.
[4] Andersen, B., Borns, H., 1994, The Ice Age World, Oxford University Press. ISBN 978-8200218104
[5] Obbink, E. et al., 2010, Eastern North American freshwater discharge during the Bolling-Allerod warm periods. Geology, 38, 171-174. 10.1130/G30389.1.
[6] Williams, C. et al., 2010, Deglacial abrupt climate change in the Atlantic Warm Pool: A Gulf of Mexico perspective, Paleoceanography, 25, PA4221, doi:10.1029/2010PA001928.
[7] Hofmann, M. and Morales Maqueda, M., 2009, Geothermal heat flux and its influence on the oceanic abyssal circulation and radiocarbon distribution, Geophys. Res. Lett., 36, L03603, doi:10.1029/2008GL036078.
[8] Richards, A. et al., 2022, Spatial and temporal variability of Atlantic Water in the Arctic from 40 years of observations. Journal of Geophysical Research: Oceans, 127, e2021JC018358. https://doi.org/10.1029/2021JC018358