


14 - The causes of the initial melting
The death of cool


The previous post reached the conclusion that the Last Glacial Period (LGP) ended when Northern and Southern Hemisphere sea ice covers started to melt. This is fairly uncontentious: ice melting literally defines the end of the LGP, and it is almost certain that it started with the relatively thin and vulnerable sea ice covers. Explanations will however become progressively more contentious from here on in, as many opinions and theories exist on the end-of-LGP causes.
The expansion of the interglacial steady-state area

An interglacial period replaces its glacial predecessor via the melting of onshore ice cover. The relatively steady melting of the onshore ice cover over the over the 22,000 - 7,000 BP period resulted in:
a fairly steady sea level rise
steady increases in the Earth’s stored energy: the “negative” energy stored in the onshore ice sheets was progressively being reduced.
steady increases in solar irradiation energy absorption (increased albedo)
steady increases in atmospheric heat retention (increased greenhouse effect)
a steady increase in global mean surface temperatures
Antarctic melting during the FIP and OD
The previous post demonstrated that the circum-Antarctic sea ice cover was melting during the First Interglacial Period (FIP) and the Oldest Dryas (OD). What caused this melt? Two possibilities exist:
The sea ice was mainly melted from above, by the sun’s energy
The sea ice was mainly melted from below, by the ocean’s energy
The first can happen due to a sudden change in either solar irradiation energy or sea ice albedo, e.g. through dust or soot accumulating on its surface. Neither are likely. A previous post demonstrated that solar irradiation energy has remained relatively constant for the last 140 years, so is fairly invariable and therefore an unlikely cause of a sudden melt after ~100,000 years of growth. Note that solar irradiation increases due to Milankovitch cycles were relatively minor during the FIP and OD (discussed in a future post). If albedo changes were responsible for a summer sea ice melt then the following winter’s fresh sea ice cover would restore its high sea ice albedo. It is therefore very likely that warming oceans caused the sea ice cover to melt, in a manner similar to the present-day Arctic ice cover retreating due to the post-1995 North Atlantic ocean warming[1]. Such a warming ocean can trigger a positive feedback loop: long-lasting delays in winter sea ice forming allow the low albedo open ocean more time to absorb and retain solar energy, thereby further warming the ocean and expanding the interglacial steady-state area.
The melting of a significant part of the Antarctic sea ice cover did not significantly raise sea levels. The previous post showed that the circum-Arctic sea ice cover roughly formed a circle around the South Pole with a 4000 km radius. A 1 m thick sea ice cover of its outer 1000 km ring (2.2 107 km2) represents 2.2 104 km3 of ice, or ~20 103 km3 of water. Assuming an ocean area of 350 106 km2 the sea level rise caused by the Antarctic sea ice melt would be ~6 cm.
Northern Hemisphere melting during the FIP and OD
An analogous reasoning for the Northern Hemisphere suggests warming oceans caused North Atlantic sea ice melting. Supporting evidence is provided by sea surface temperature (SST) proxies from sediment core studies[2] (graph below) that indicate Gulf of Mexico SST’s rose by 2-5 °C during the OD. The peculiar cooling around 15,500 BP was very likely caused by the meltwaters of the Western Canada and Great Lakes glaciers draining via the Missouri/Mississippi into the Gulf of Mexico (see next post), while the warming around 15,000 was likely due to renewed Missouri ice-damming by advancing glaciers in the Montana-South Dakota - Iowa area.

The melting of offshore sea ice cover by warming oceans is an effective catalyst for the melting of adjacent onshore ice sheets. For example, the post-1995 warming of the Northern Atlantic caused the progressive melting of the offshore Greenland sea ice cover between 1995-2019, which in turn caused increases of up to 40 melting days for large areas of coastal Greenland. The previous post documented the onshore melting in the New York area between 19,500 - 18,500 BP. At the time of the LGM offshore New York was at the edge of the sea ice cover, so its sea temperature would have been around freezing, about 6 °C colder than at present. Raising offshore New York sea temperatures by a few degrees therefore would have resulted in the sea ice cover retreating northwards. Once an offshore sea ice cover has disappeared, offshore winds can pick up latent heat energy (15 W m-2 per m/s of wind velocity) to raise coastal temperatures above freezing, melt the near-coastal snow and ice cover, and raise near-coastal albedo, thereby causing the onshore ice sheets to also retreat northwards. Such an onshore interglacial bridgehead allows the newly ice-free area more time to absorb and retain solar energy, thereby locally expanding the interglacial steady-state area.

The cold glacial meltwaters largely drained via a Mohawk River predecessor, the Iro-Mohawk (see figure below), via the Hudson into the Atlantic Ocean.

By 19,000 BP the large volumes of cold, sweet meltwaters entering the North Atlantic at New York Harbor caused the east coast sea temperatures to cool again and caused the Gulfstream current to take a more southerly trajectory, which in turn caused sea ice cover to partially re-establish itself, albeit a bit further north of its LGM position, which in turn caused onshore temperatures in both the Great Lakes area and Greenland to decrease again. This process - termed the status quo cycle - will be further discussed in 2 weeks time.

Europe
The Eurasian ice sheet retreat during the FIP and OD was characterized by:
The melting of the “North Sea” ice cover around 18,500 BP. Note that at this time the area was above sea level, and that the area overlies a geothermal heat anomaly (see below)
During the OD, most of onshore ice cover in the UK and Denmark melted, as did the sea ice cover between Svalbard and Scandinavia. The return of the Dryas octopetala artic-alpine indicator flora in large parts of Eurasia during the OD suggests the melting occurred despite surface temperatures decreases.
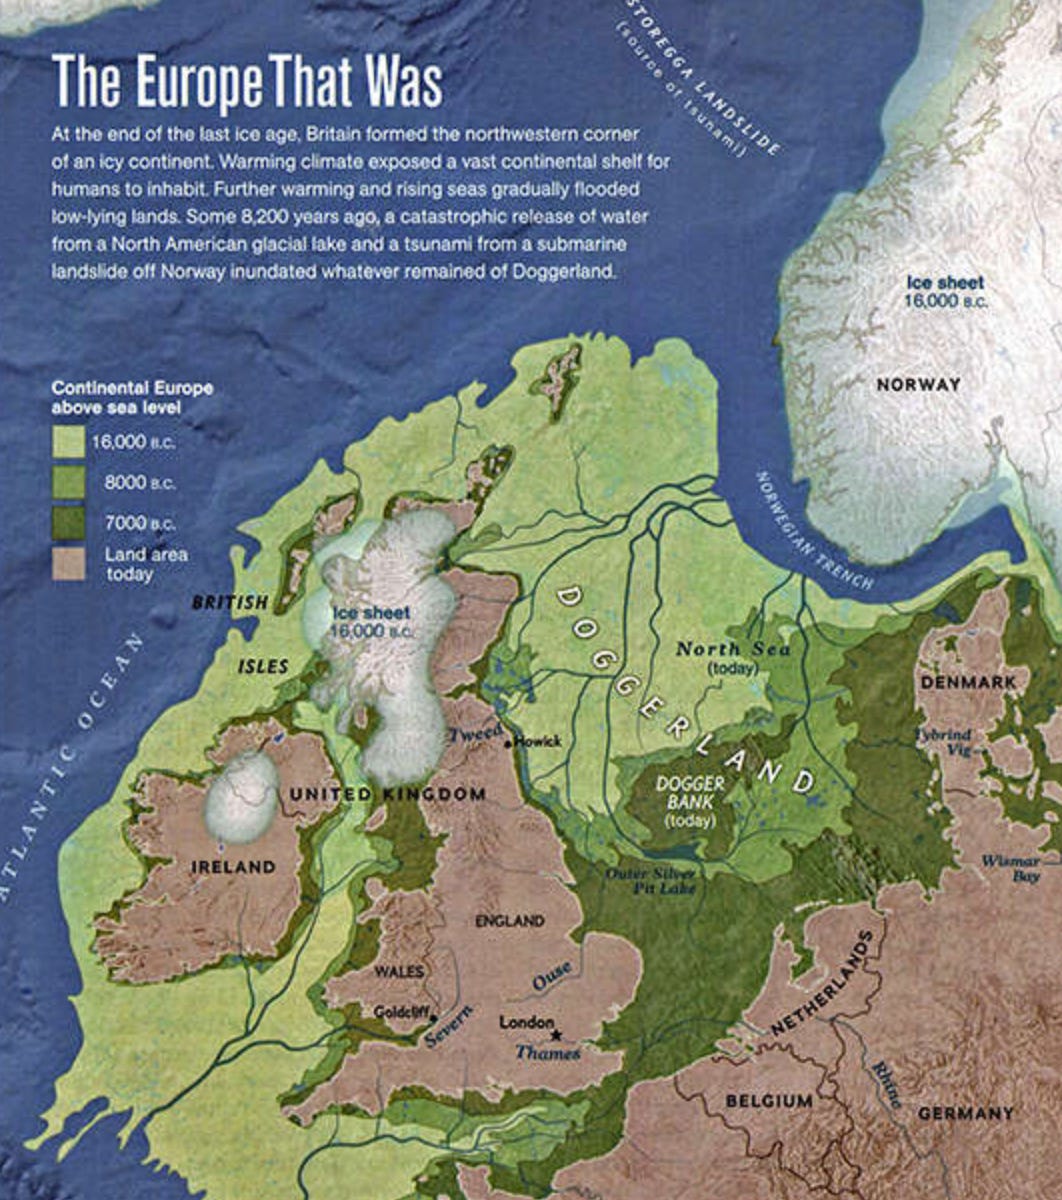
Paleogeographic reconstruction of Europe around 18,000 BP (light green). Souce: National Geographic

Western North America

In western North America a “corridor” melted along the Laurentide (eastern) and Cordilleran (western) suture zone during the OD. The heat energy that initiated this melting very likely did not come from open oceans or from solar irradiation. If solar irradiation initiated the melt then the corridor should have melted from south to north along an east-west front in stead of from north and south towards the middle. Energy transported via weather systems from open oceans would have had to pass over glacial steady-state areas, such as the Cordilleran Ice Sheet, which during much of the OD was in the “Goldilocks Zone”: glaciers advanced southwards after the LGM in the Washington State area[5]. During the LGM this “corridor” area’s climate was very likely similar to the severely freezing central parts of Antarctica: its great distance from open oceans would place it in either a cold, dry “Low Growth Zone” or a cold, snowy “Goldilocks Zone”.
Evidence suggests the corridor was melted from below[4], and that it was mainly Earth-internal heat (geothermal heat) that initiated the “corridor” melt. Once an interglacial beachhead area had been established, its low albedo allowed more time for the corridor to absorb and retain solar energy, thereby expanding the interglacial steady-state area
Geothermal Heat

Geothermal energy has been introduced as a possible heat source responsible for initiating melting. The following posts will explore this possibility in more detail. For now it’s enough to notice that the Western Europe and Western North America melting locations, as well as the Patagonian Ice Sheet that quickly melted around 17,500 BP [7], overlie local geothermal heat anomalies.
Summary
This post has taken the identification of the causes of the end of the LGP one step further. After the LGM the Antarctic and North American sea ice covers very likely retreated due to an increase in local sea temperatures. The disappearance of the offshore New York sea ice cover during the OD very likely resulted in local weather systems being able to capture open ocean heat energy and transport it onshore, thereby melting of the New York and Great Lakes glaciers. However, many of the onshore melting zones were not adjacent to open oceans and therefore were very likely initially melted by a difference heat source, geothermal heat, as will be further discussed in the next post on the Lake Missoula mega-floods
References:
[1] Levitus S., et al., 2000, Warming of the World Ocean.Science, 287,2225-2229.DOI:10.1126/science.287.5461.2225
[2] Williams, C. et al., 2010, Deglacial abrupt climate change in the Atlantic Warm Pool: A Gulf of Mexico perspective, Paleoceanography, 25, PA4221, doi:10.1029/2010PA001928.
[3] Hughes, A. et al., 2015, The last Eurasian ice sheets – a chronological database and time-slice reconstruction, DATED-1. Boreas, 45, 10.1111/bor.12142.
[4] Livingstone, S. et al., 2013, Modelling North American palaeo-subglacial lakes and their meltwater drainage pathways, Earth and Planetary Science Letters, 375, 13-33, https://doi.org/10.1016/j.epsl.2013.04.017.
[5] O’Connor, Jim E. et al., 2020, The Missoula and Bonneville floods—A review of ice-age megafloods in the Columbia River basin., Earth-Science Reviews, 208, 103181.
[6] Mazzini, I. et al., 2023, A new deglacial climate and sea-level record from 20 to 8 ka from IODP381 site M0080, Alkyonides Gulf, eastern Mediterranean, Quaternary Science Reviews, 313, 108192, https://doi.org/10.1016/j.quascirev.2023.108192.
[7] Hulton, N. et al., 2002, The Last Glacial Maximum and deglaciation in southern South America. Quaternary Science Reviews , 21, 233–241